Metrics
The majority of Cloud Temple clients have visualization, monitoring, and metrics tools to track their operations.
The Console's philosophy is to enable data access to integrate into this tooling via an integrated Prometheus proxy.
This proxy allows you to query and manipulate data from a visualization tool such as Grafana.
However, it is possible to view certain performance data for your Cloud resources in the Console's web interface.
Note: The Cloud Temple philosophy is not to integrate only charts into the web interface, but also to provide the maximum amount of information accessible via the API
Integrated dashboards in the web interface
Note: To access these dashboards, you must have the 'metric_read' permission.
Global Overview
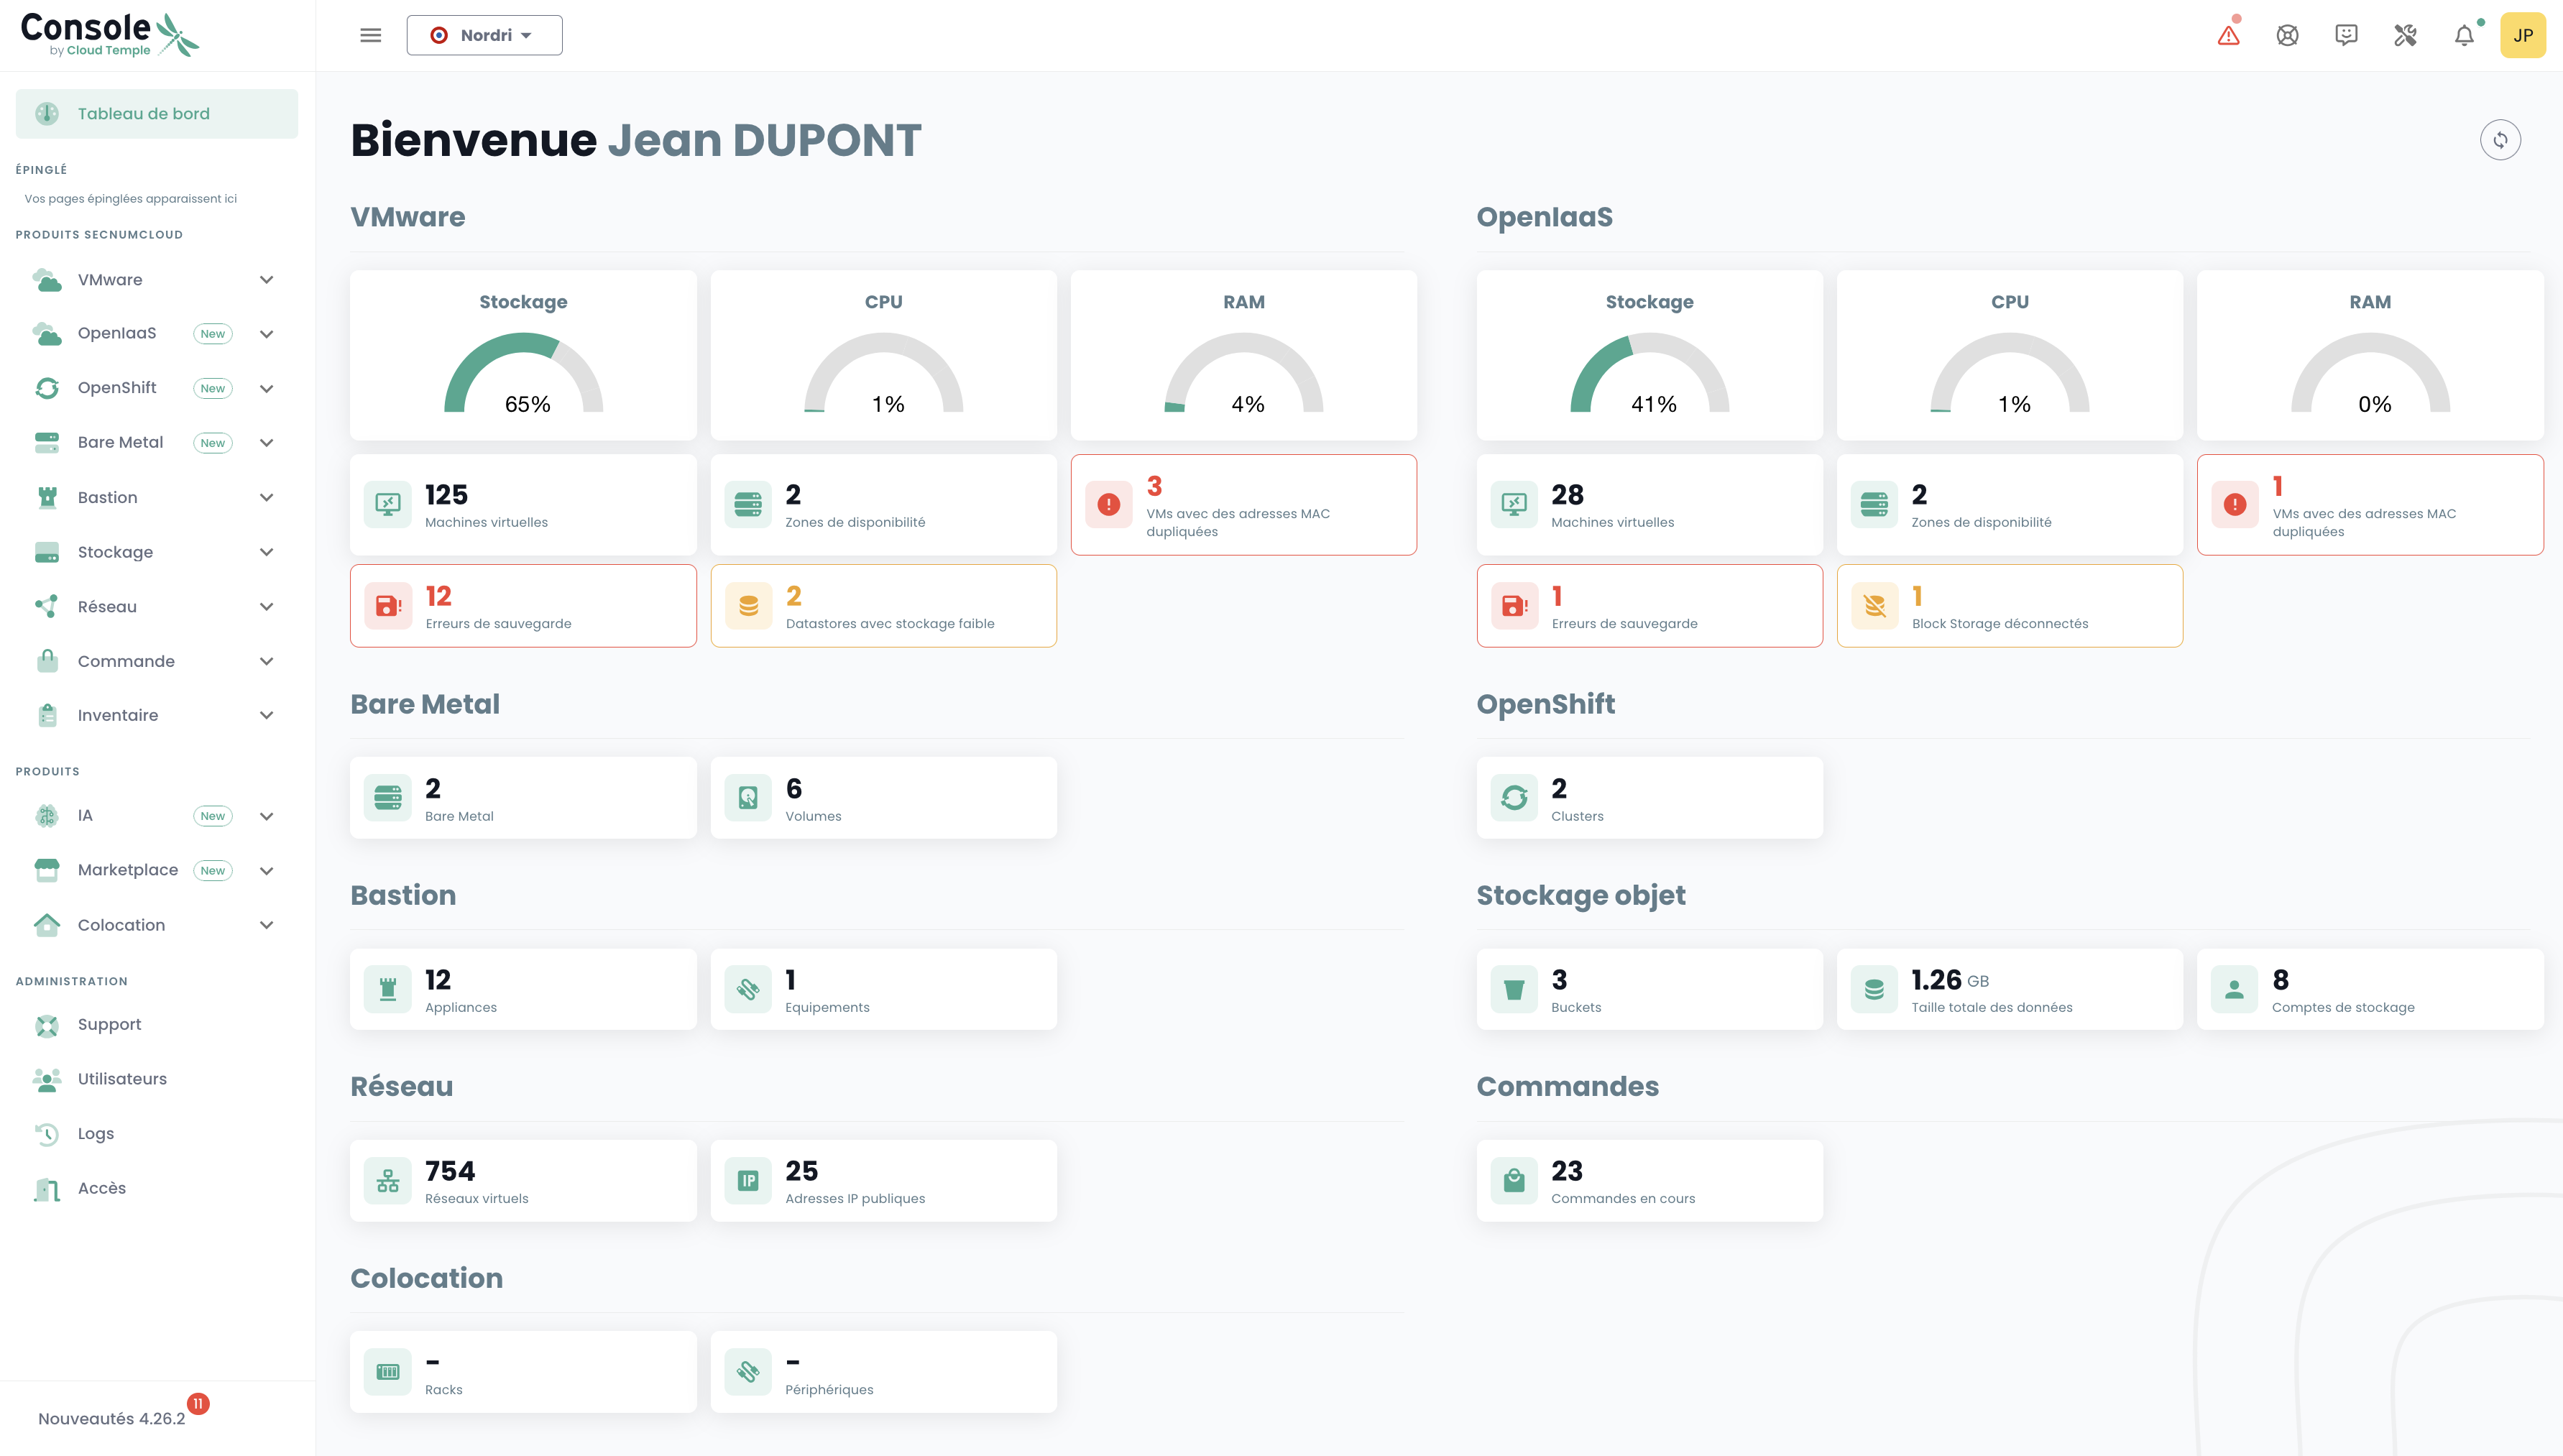
The Console home page displays the main dashboard, presenting all metrics that provide a status overview of each product you have subscribed to within your environment. In case of issue(s) with your VMware and/or OpenIaaS products, alerts will be visible, with colors indicating their severity.
These alerts are clickable and redirect to the relevant product page.
VMware Metrics - Global View
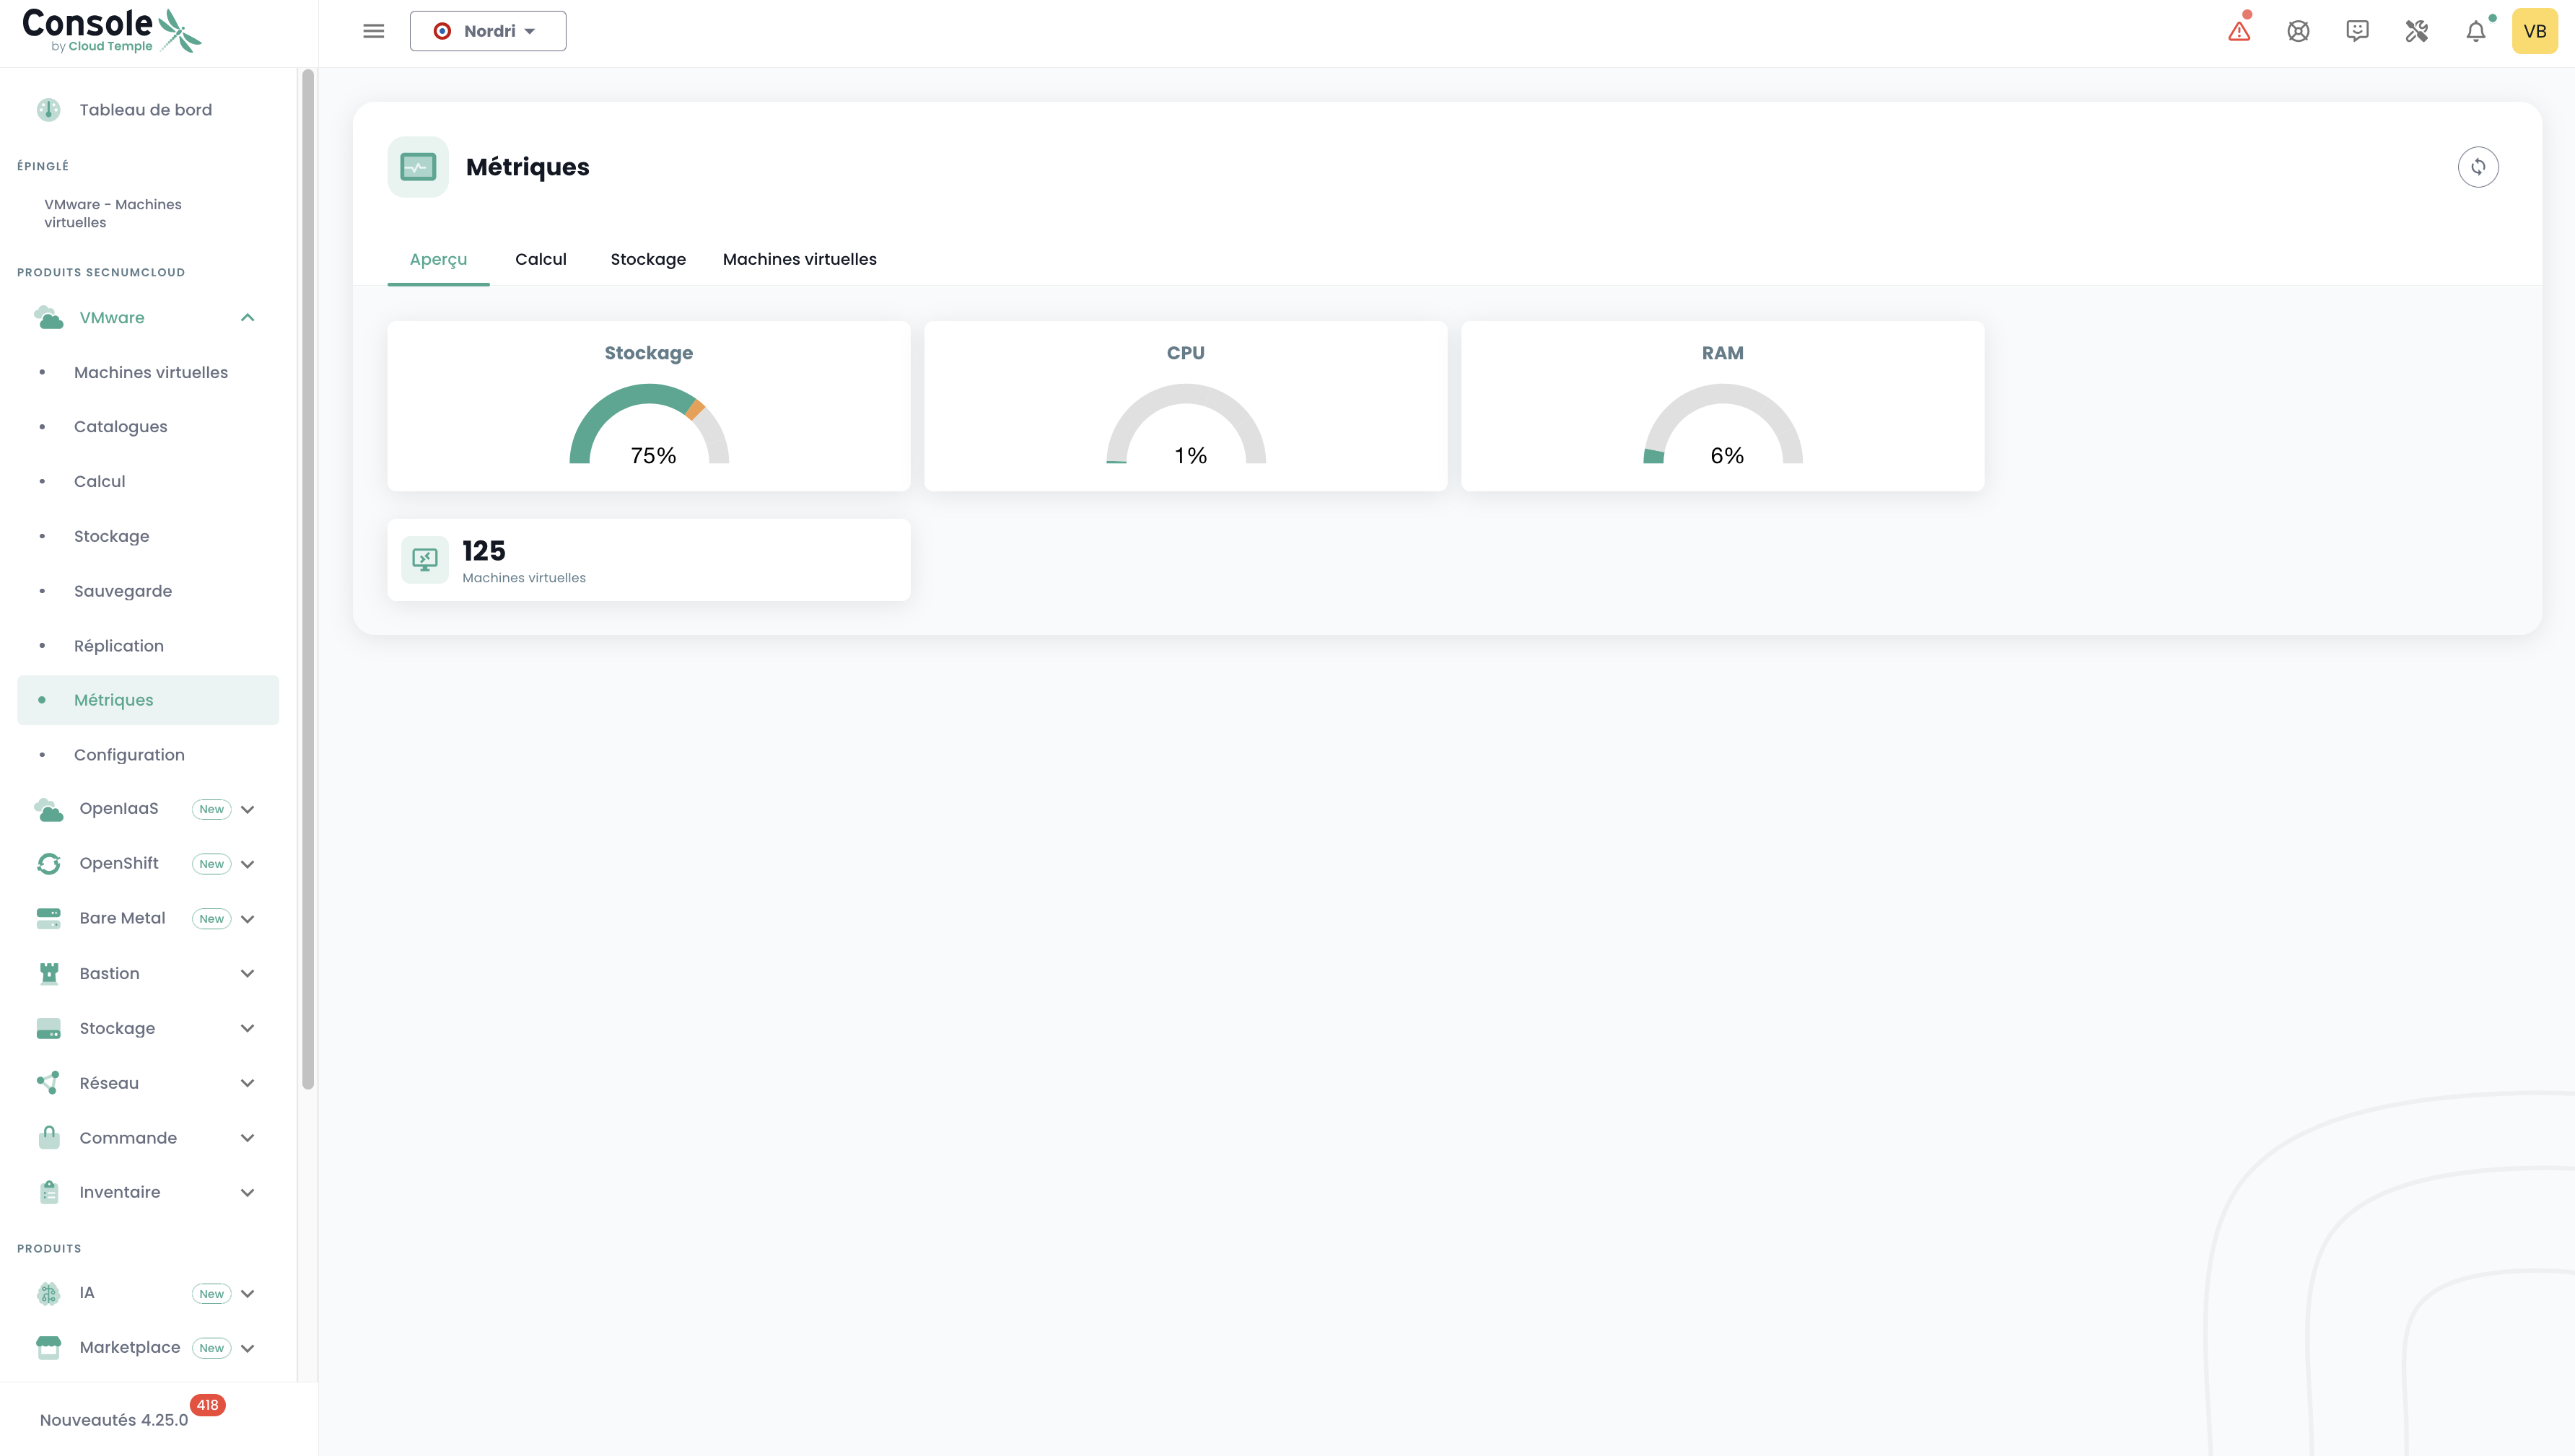
In the 'VMware' menu, a specific dashboard is available in the 'Metrics' submenu. It includes 4 tabs:
Overview
On this tab, you will find some of the metrics already present in the global dashboard discussed at the beginning of this chapter.
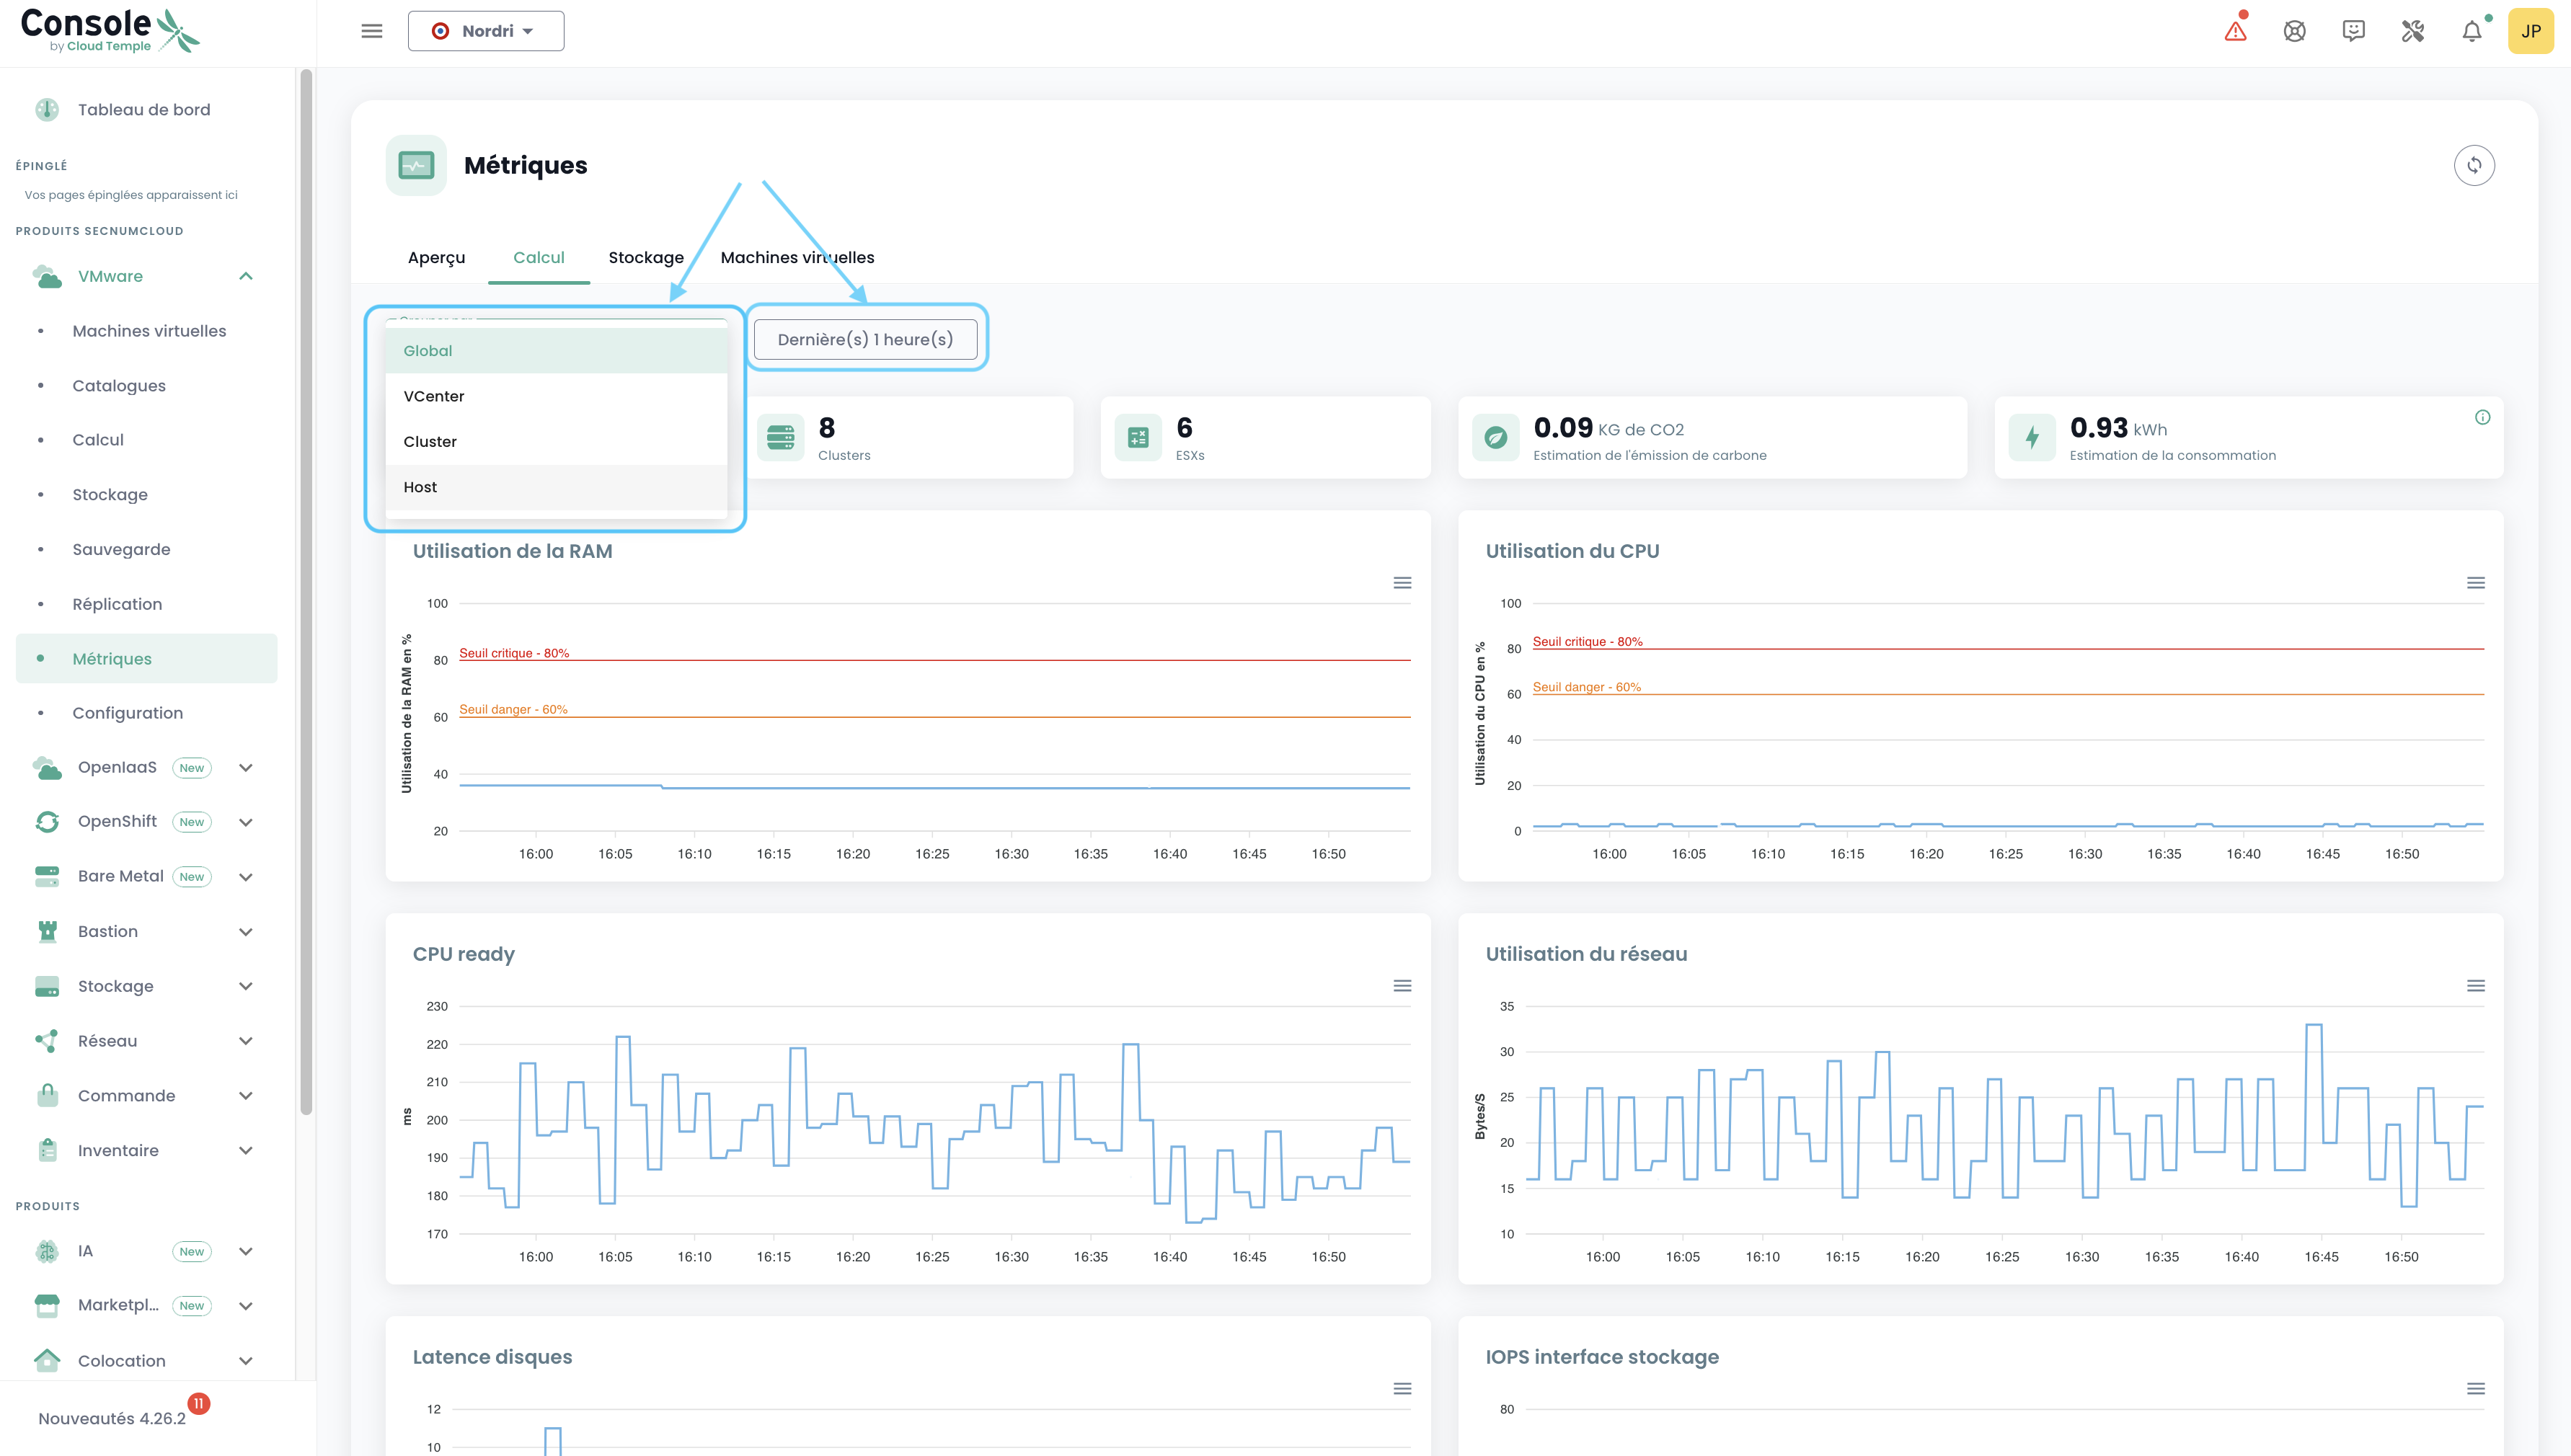
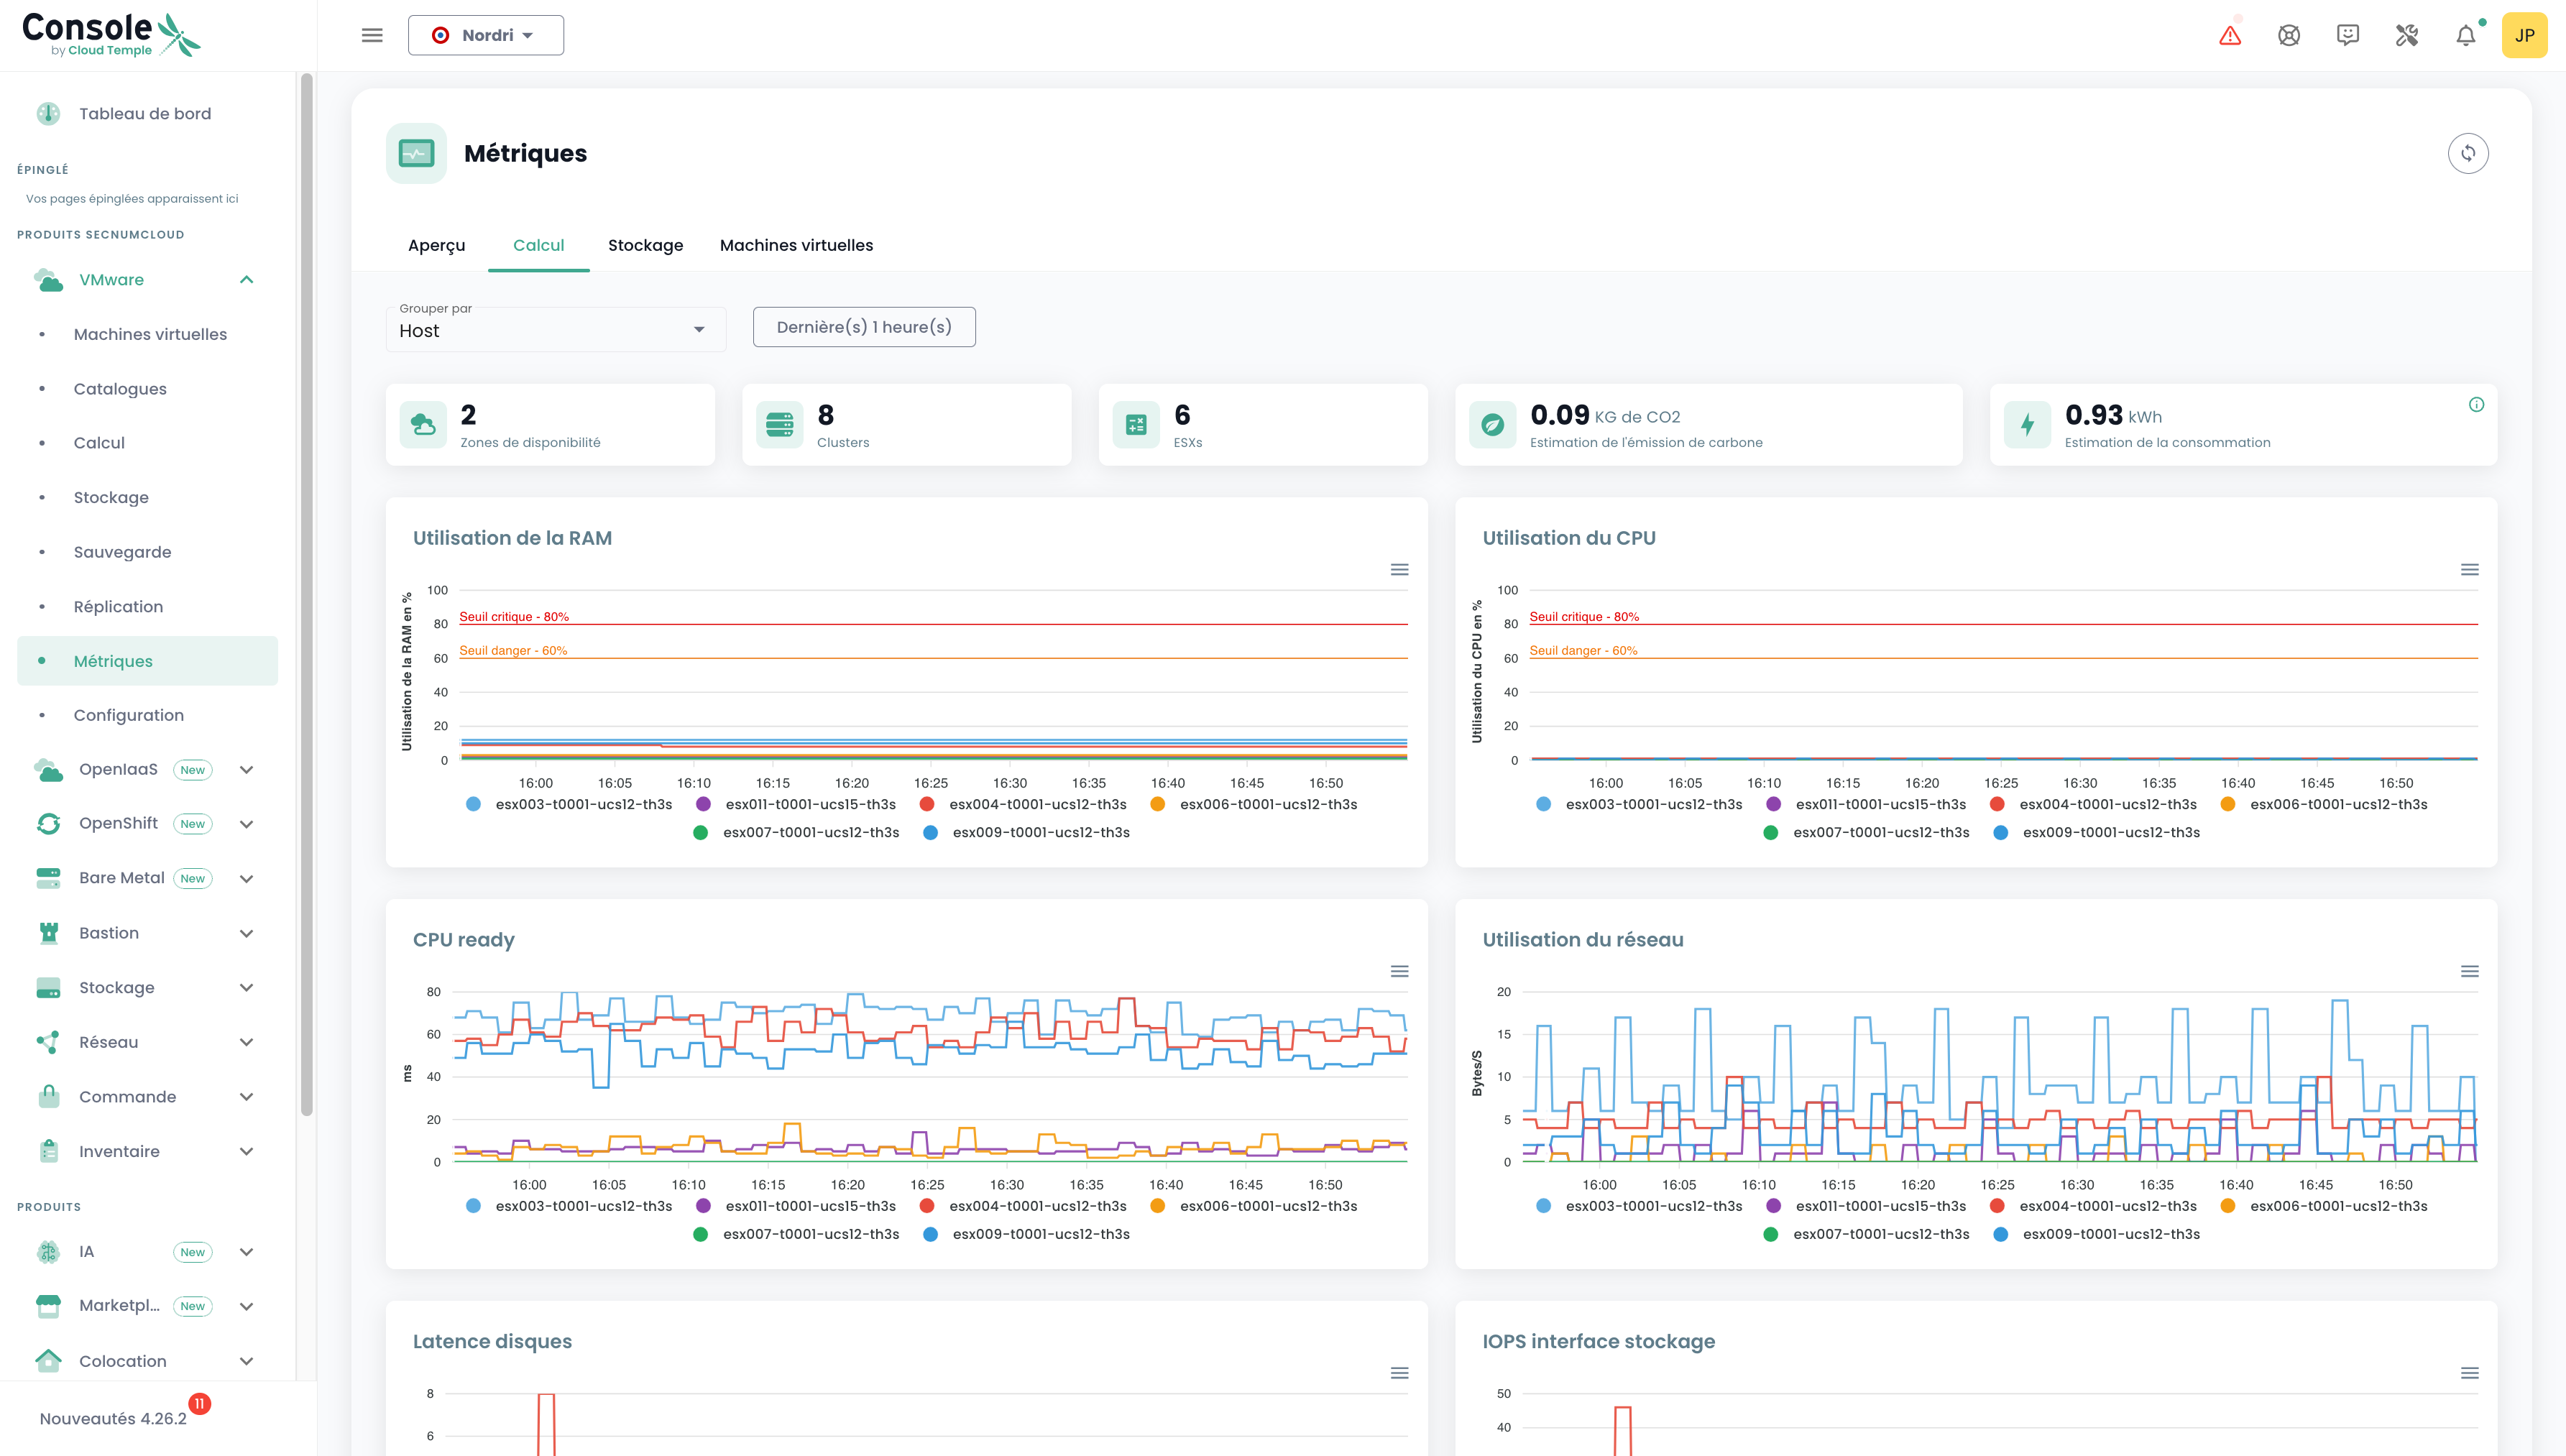
Calculation
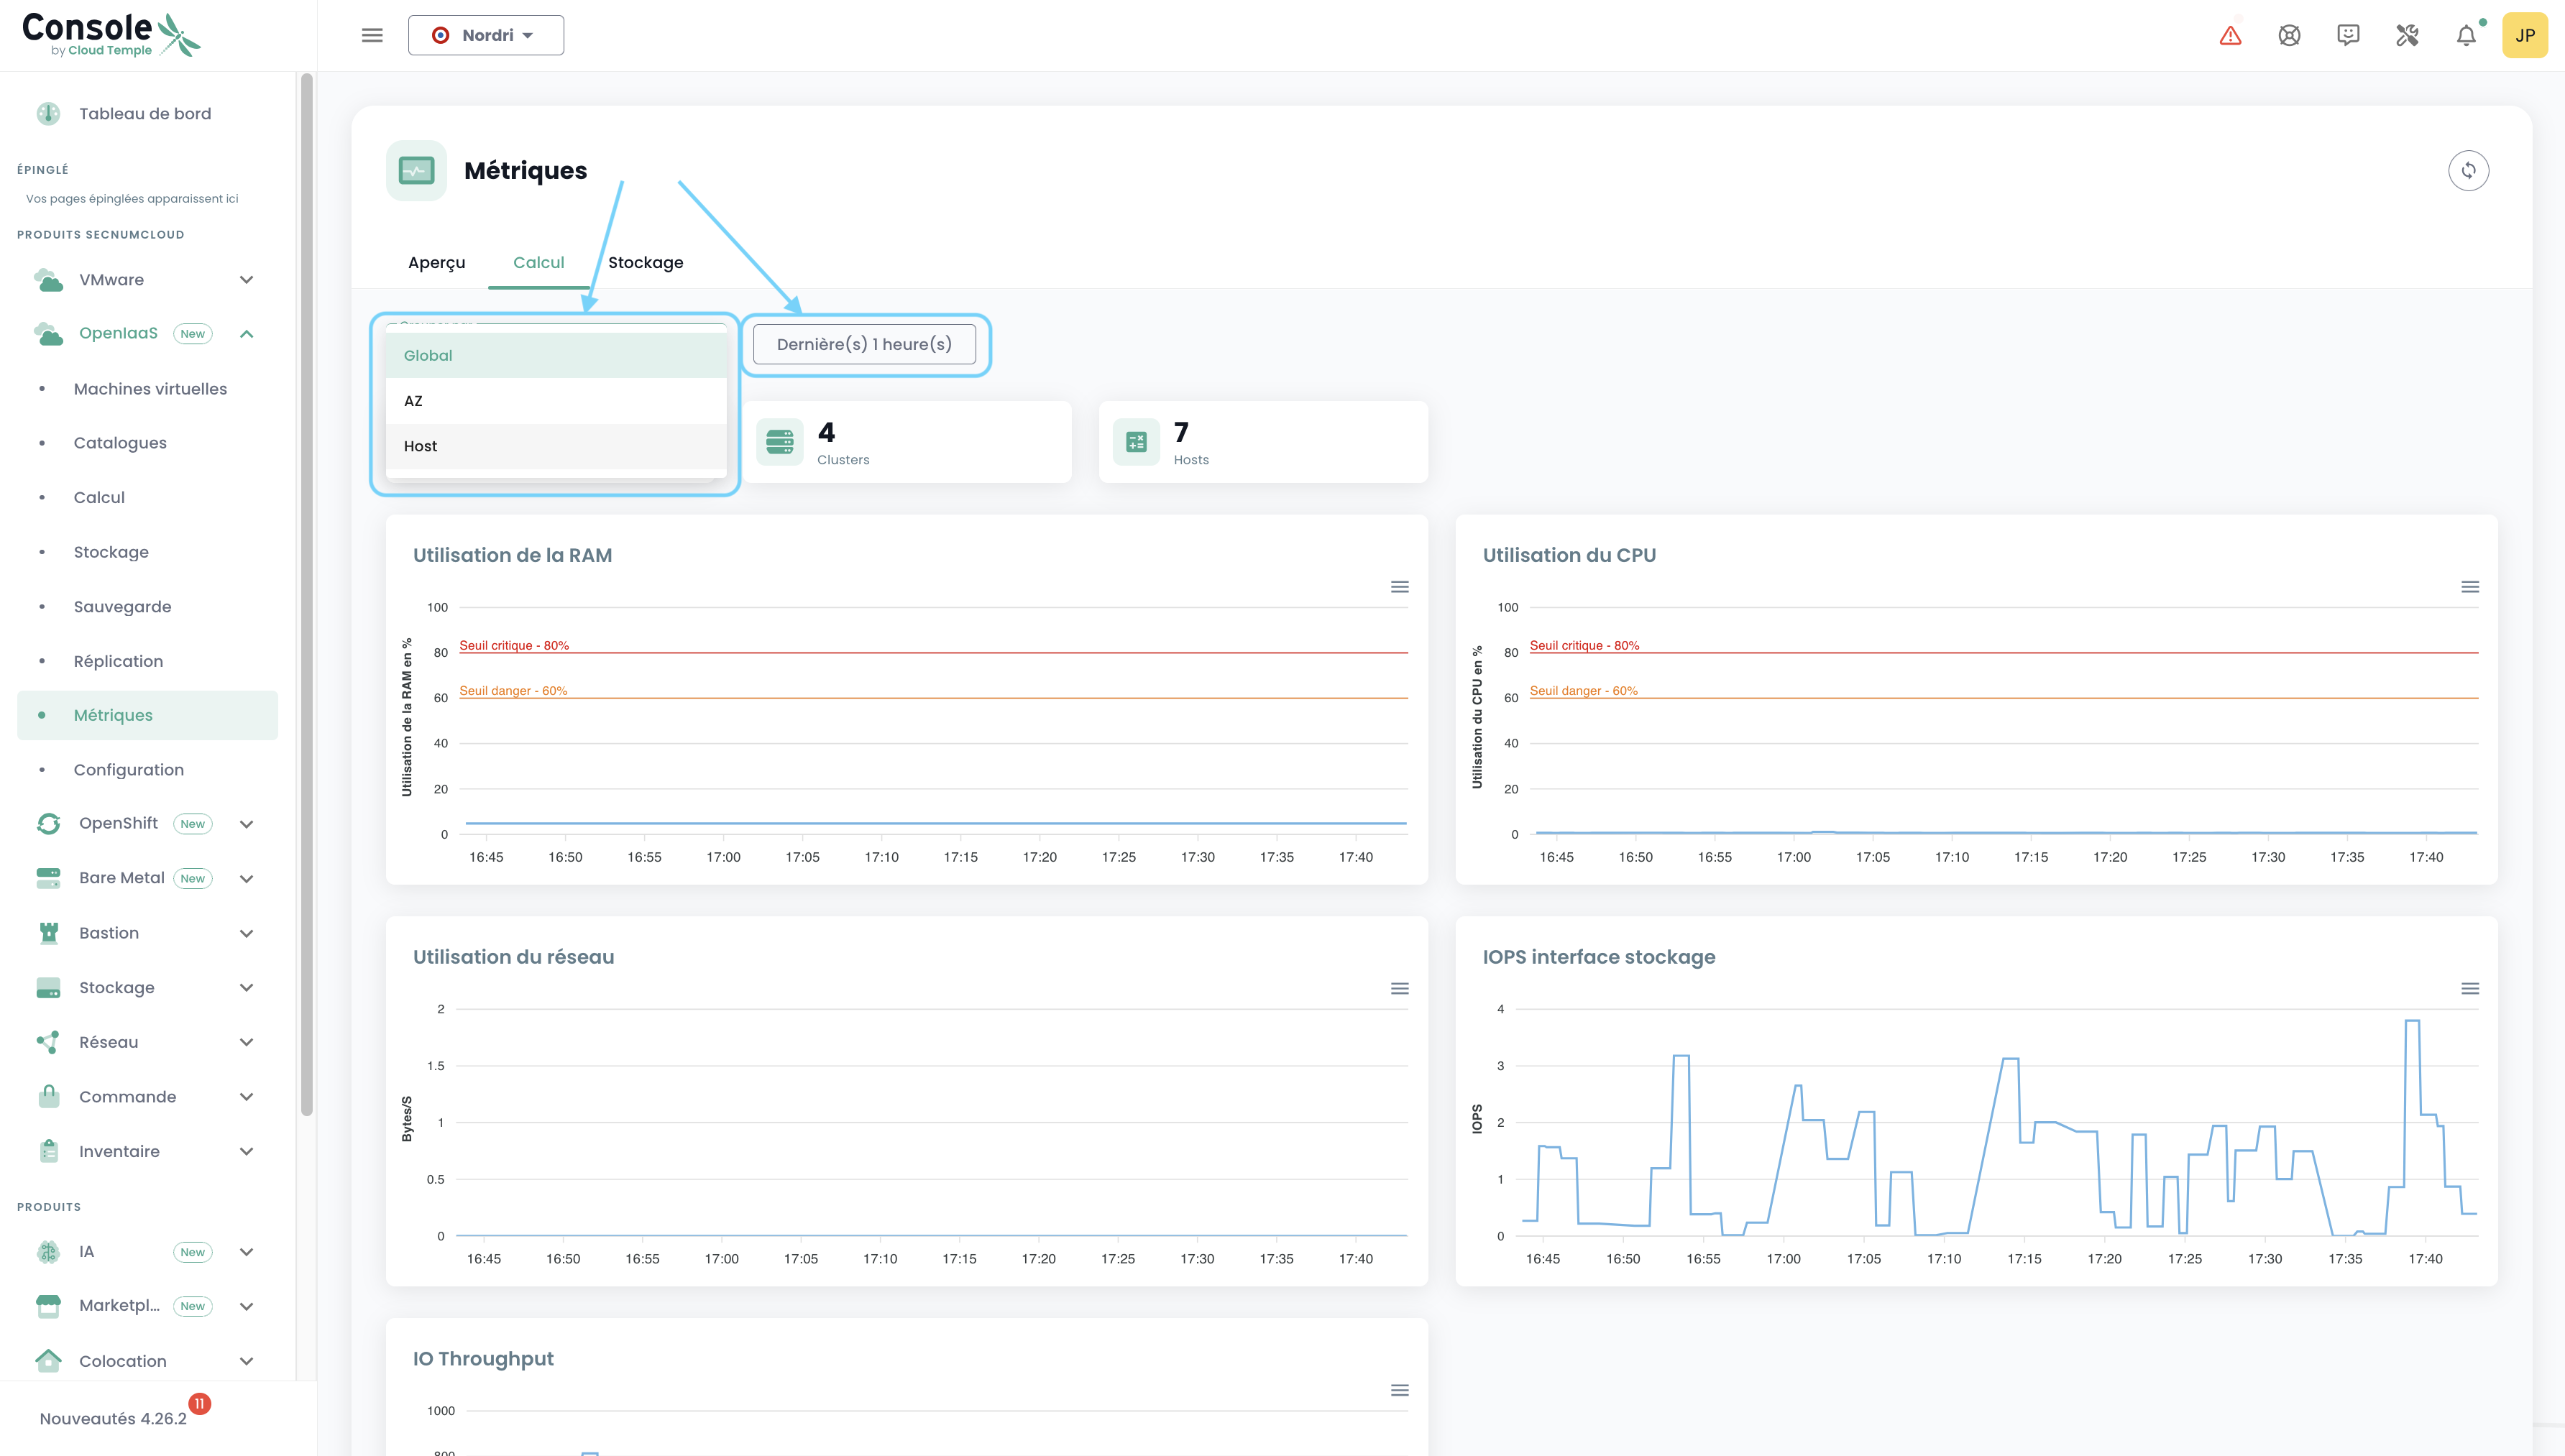
On this tab, you will find the number of AZ, Clusters, ESXs, carbon emissions, power consumption estimate, as well as 7 charts providing a highly visual overview of your VMware environment. The power consumption estimate in kW/h is calculated based on the average of readings covering the selected period, expressed per hour.
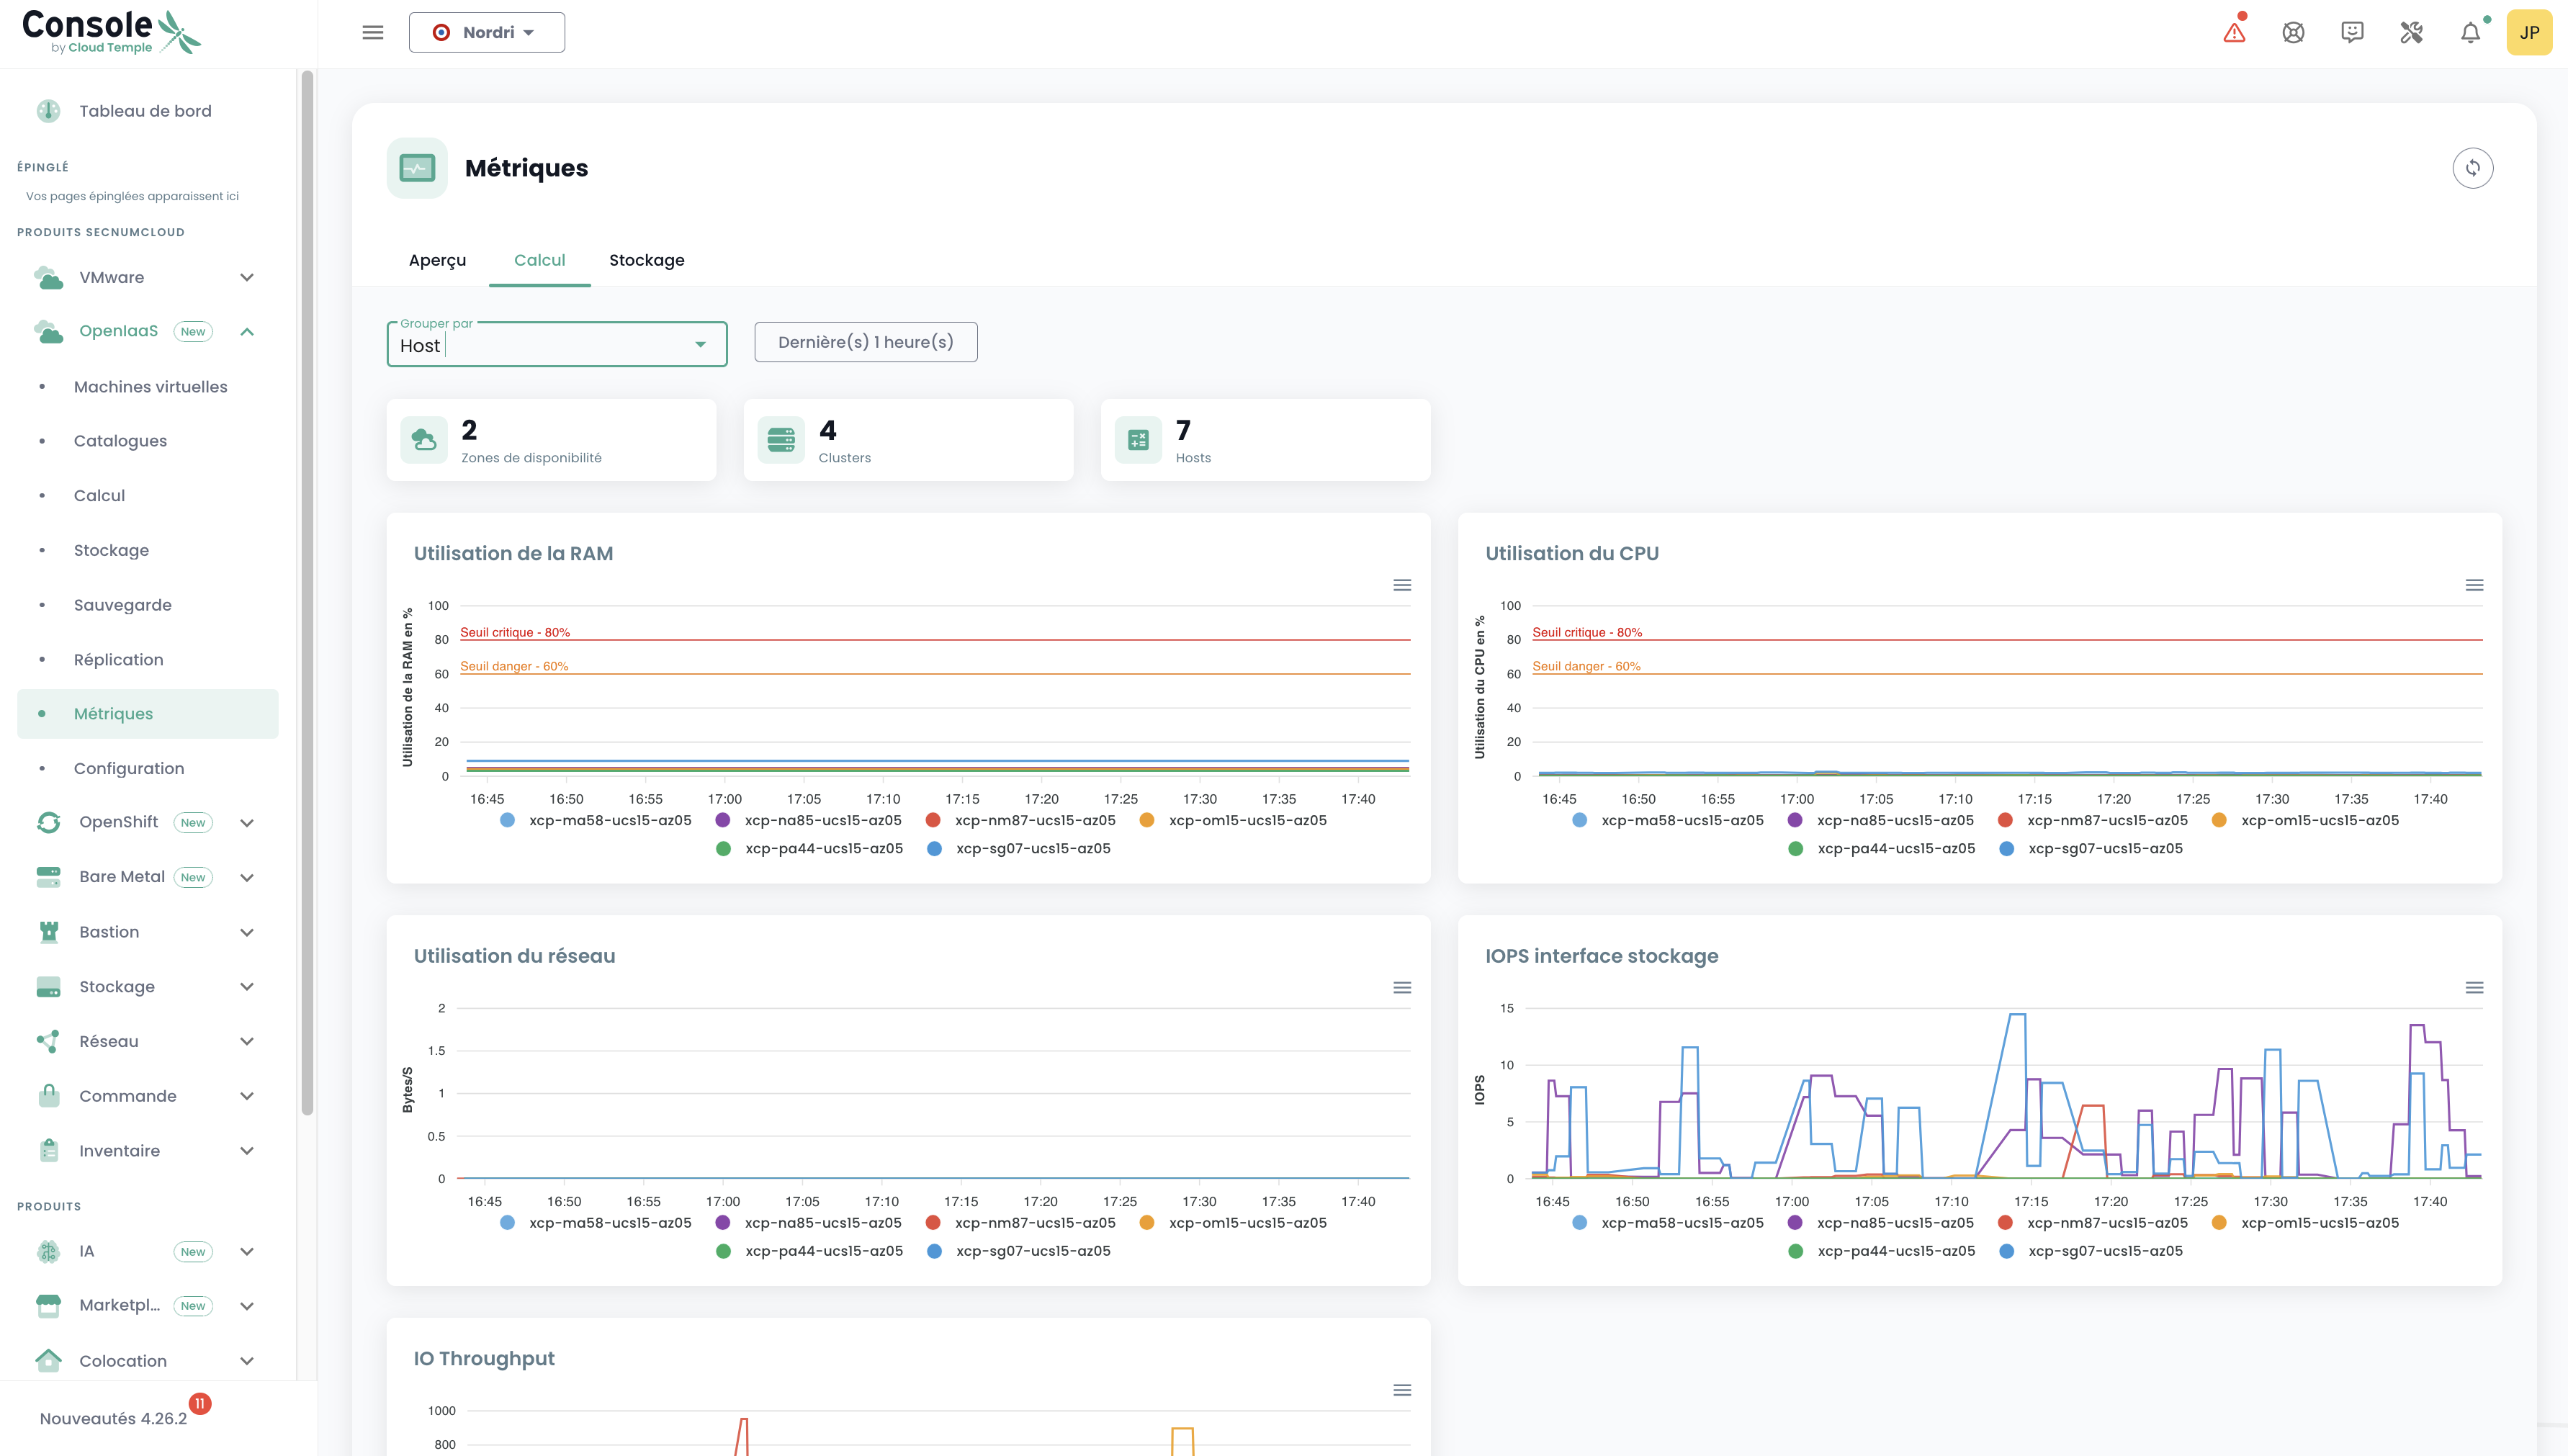
You can choose the date range to cover, as well as the data grouping type (by default, data is grouped for the entire scope). For example, by selecting Host:
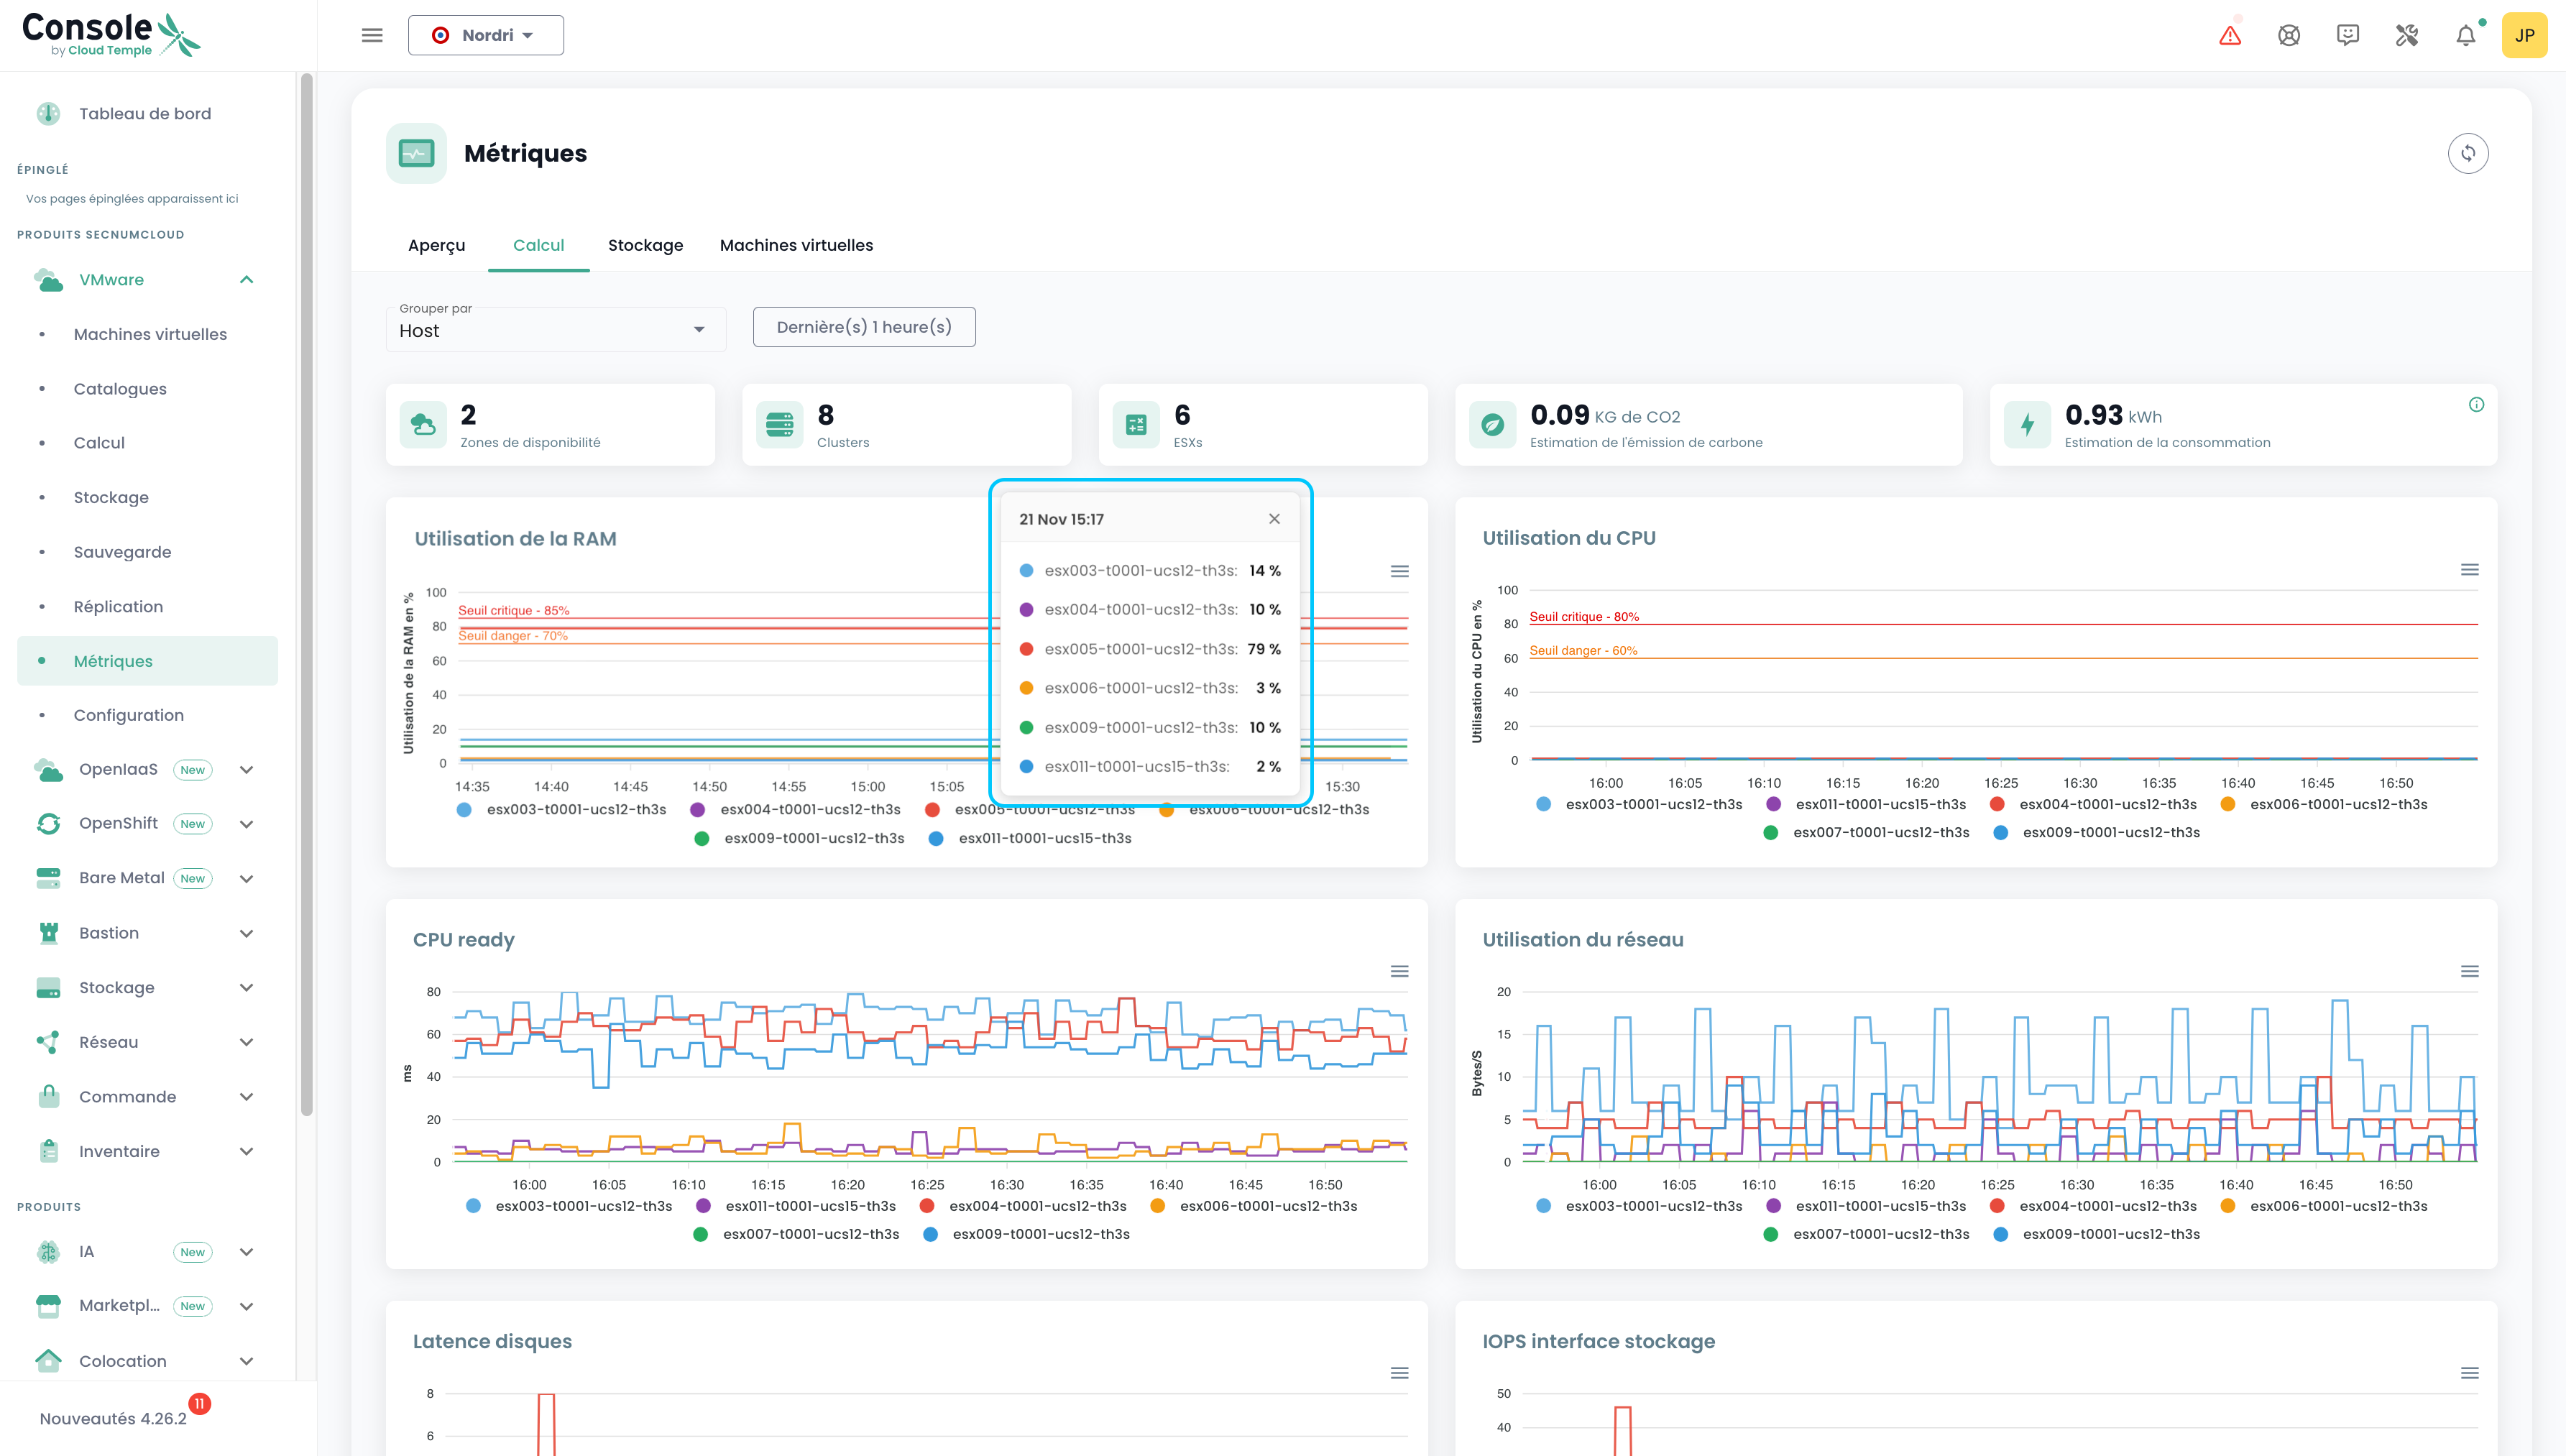
On hover over each chart, the details of resource names and their values are displayed. On clicking these same charts, a small tooltip opens, allowing you to more easily view the details corresponding to the clicked date:
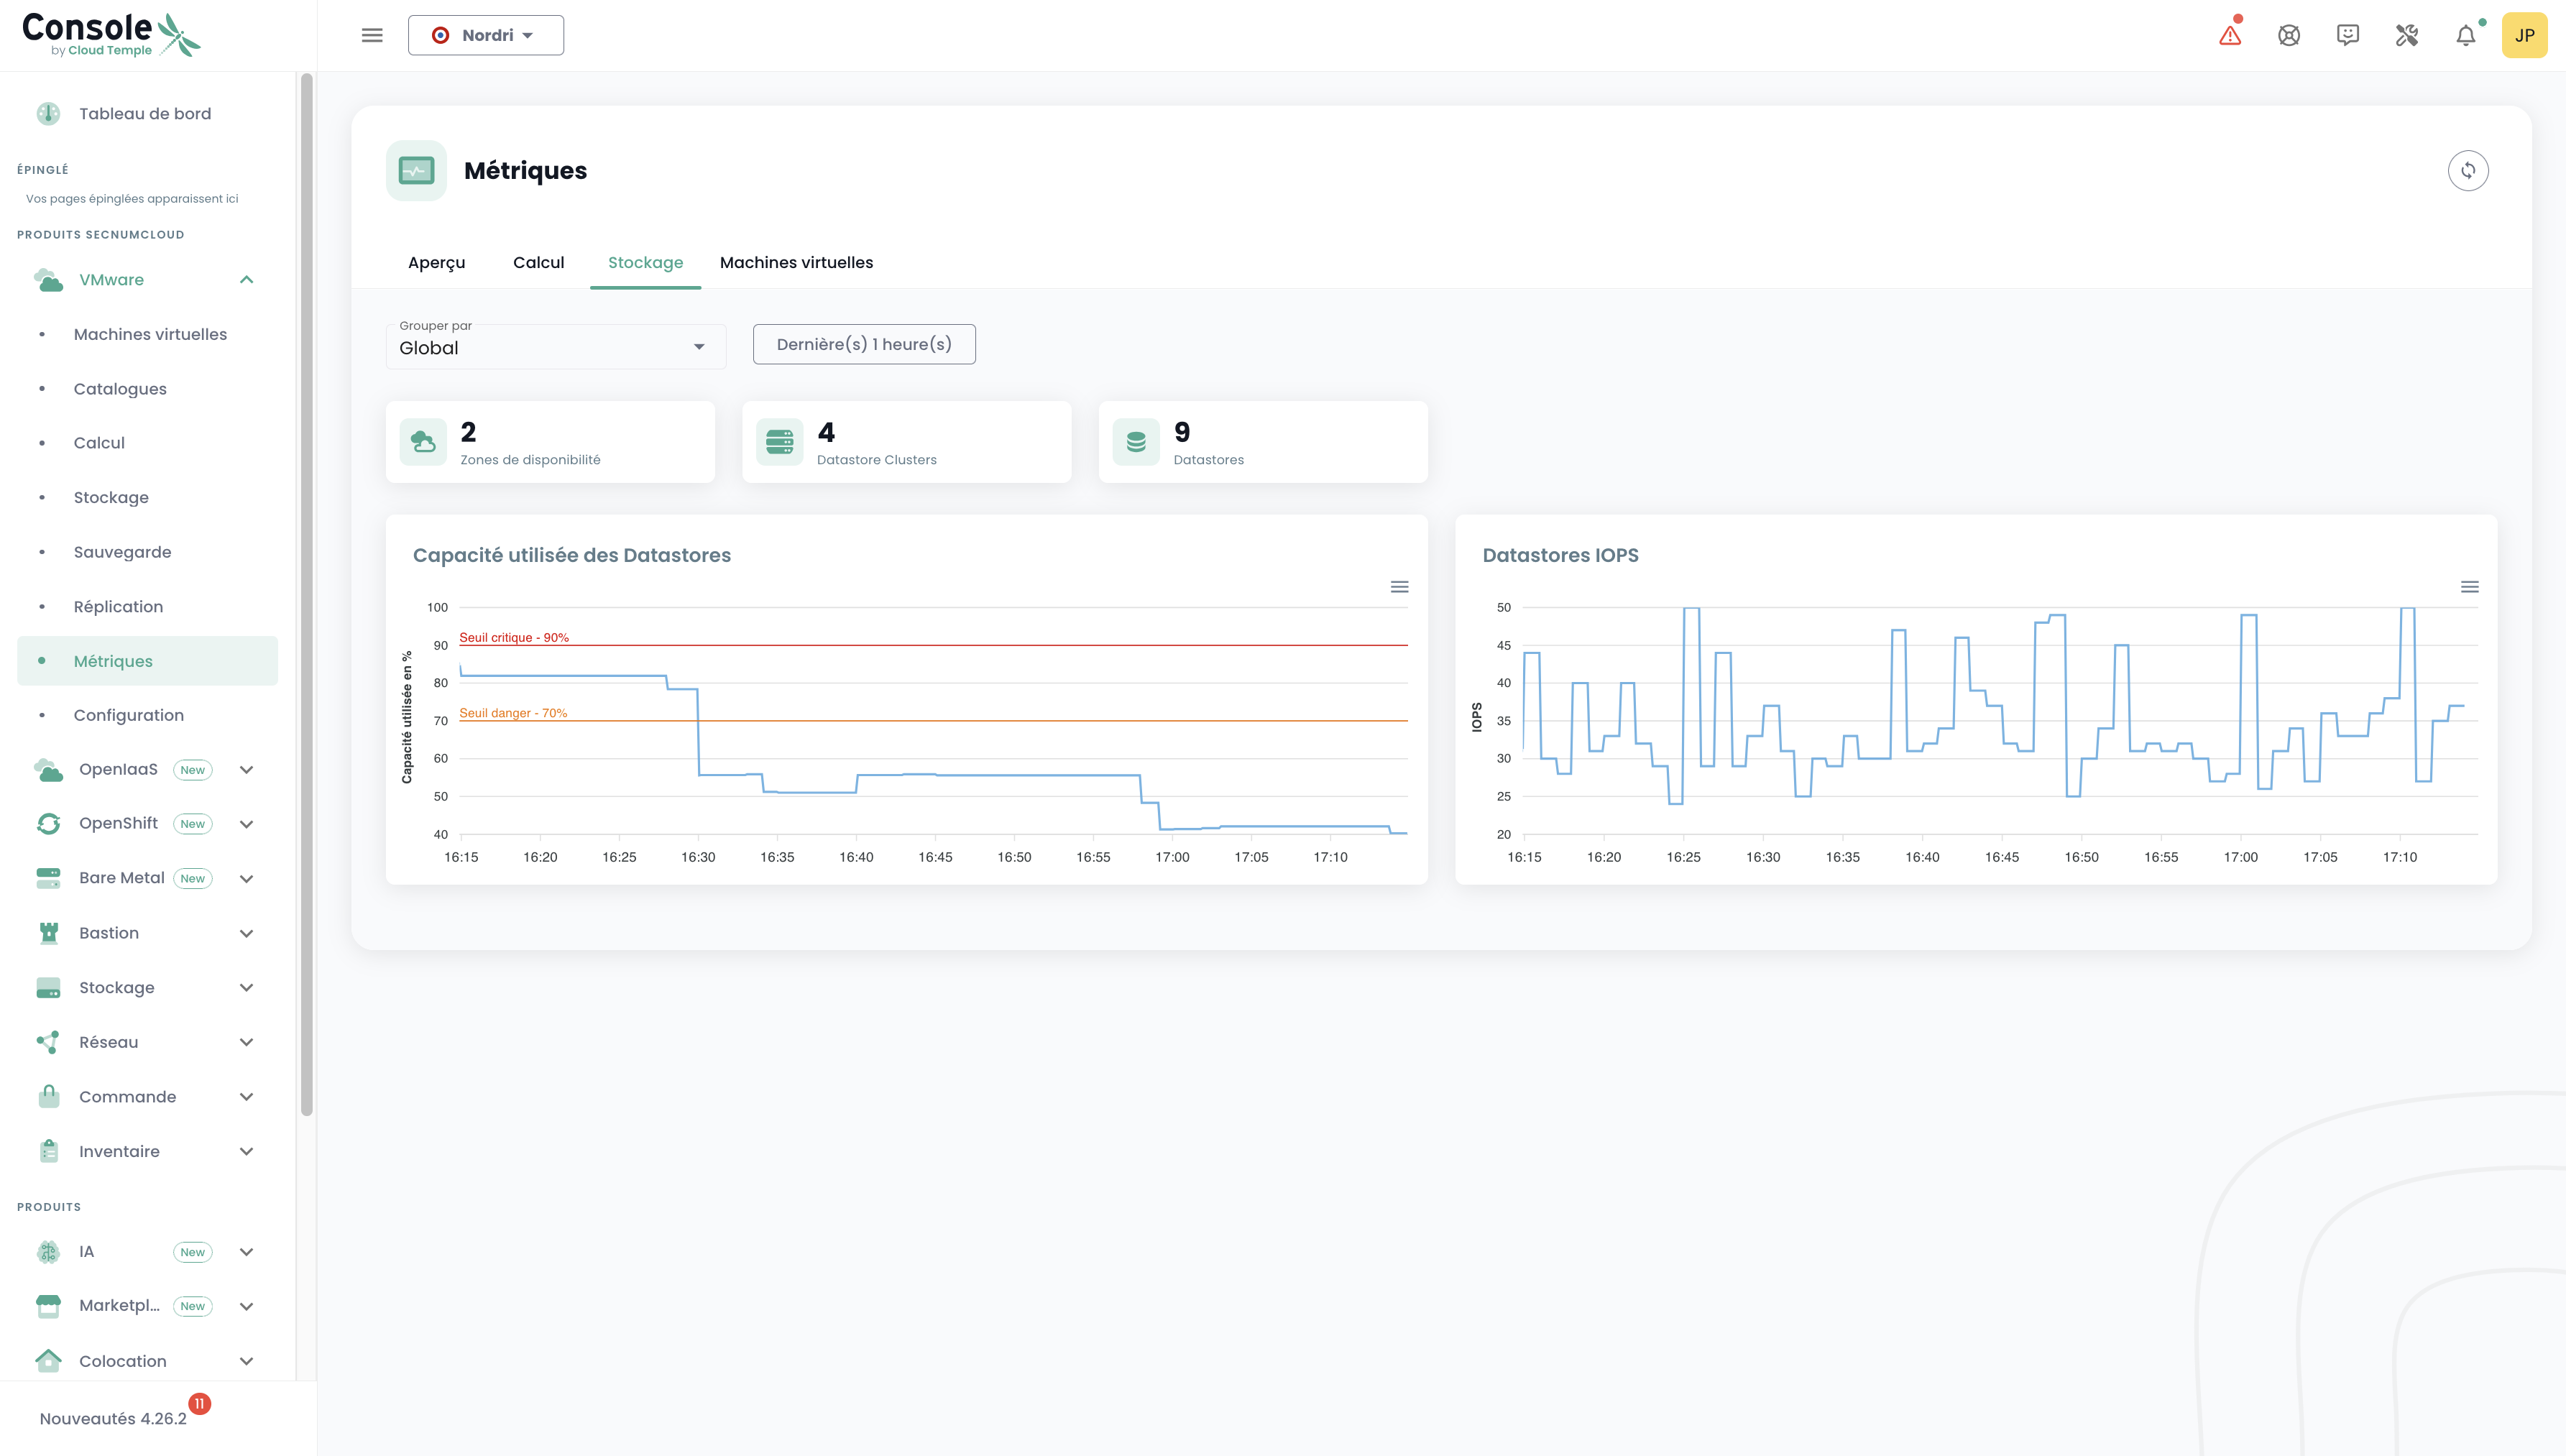
Storage
Similarly to the "Compute" tab, various information is displayed: the number of AZ, datastore clusters, datastores, as well as 2 charts. The same filtering principle applies, but here, we can group by SDRS Cluster and Datastore.
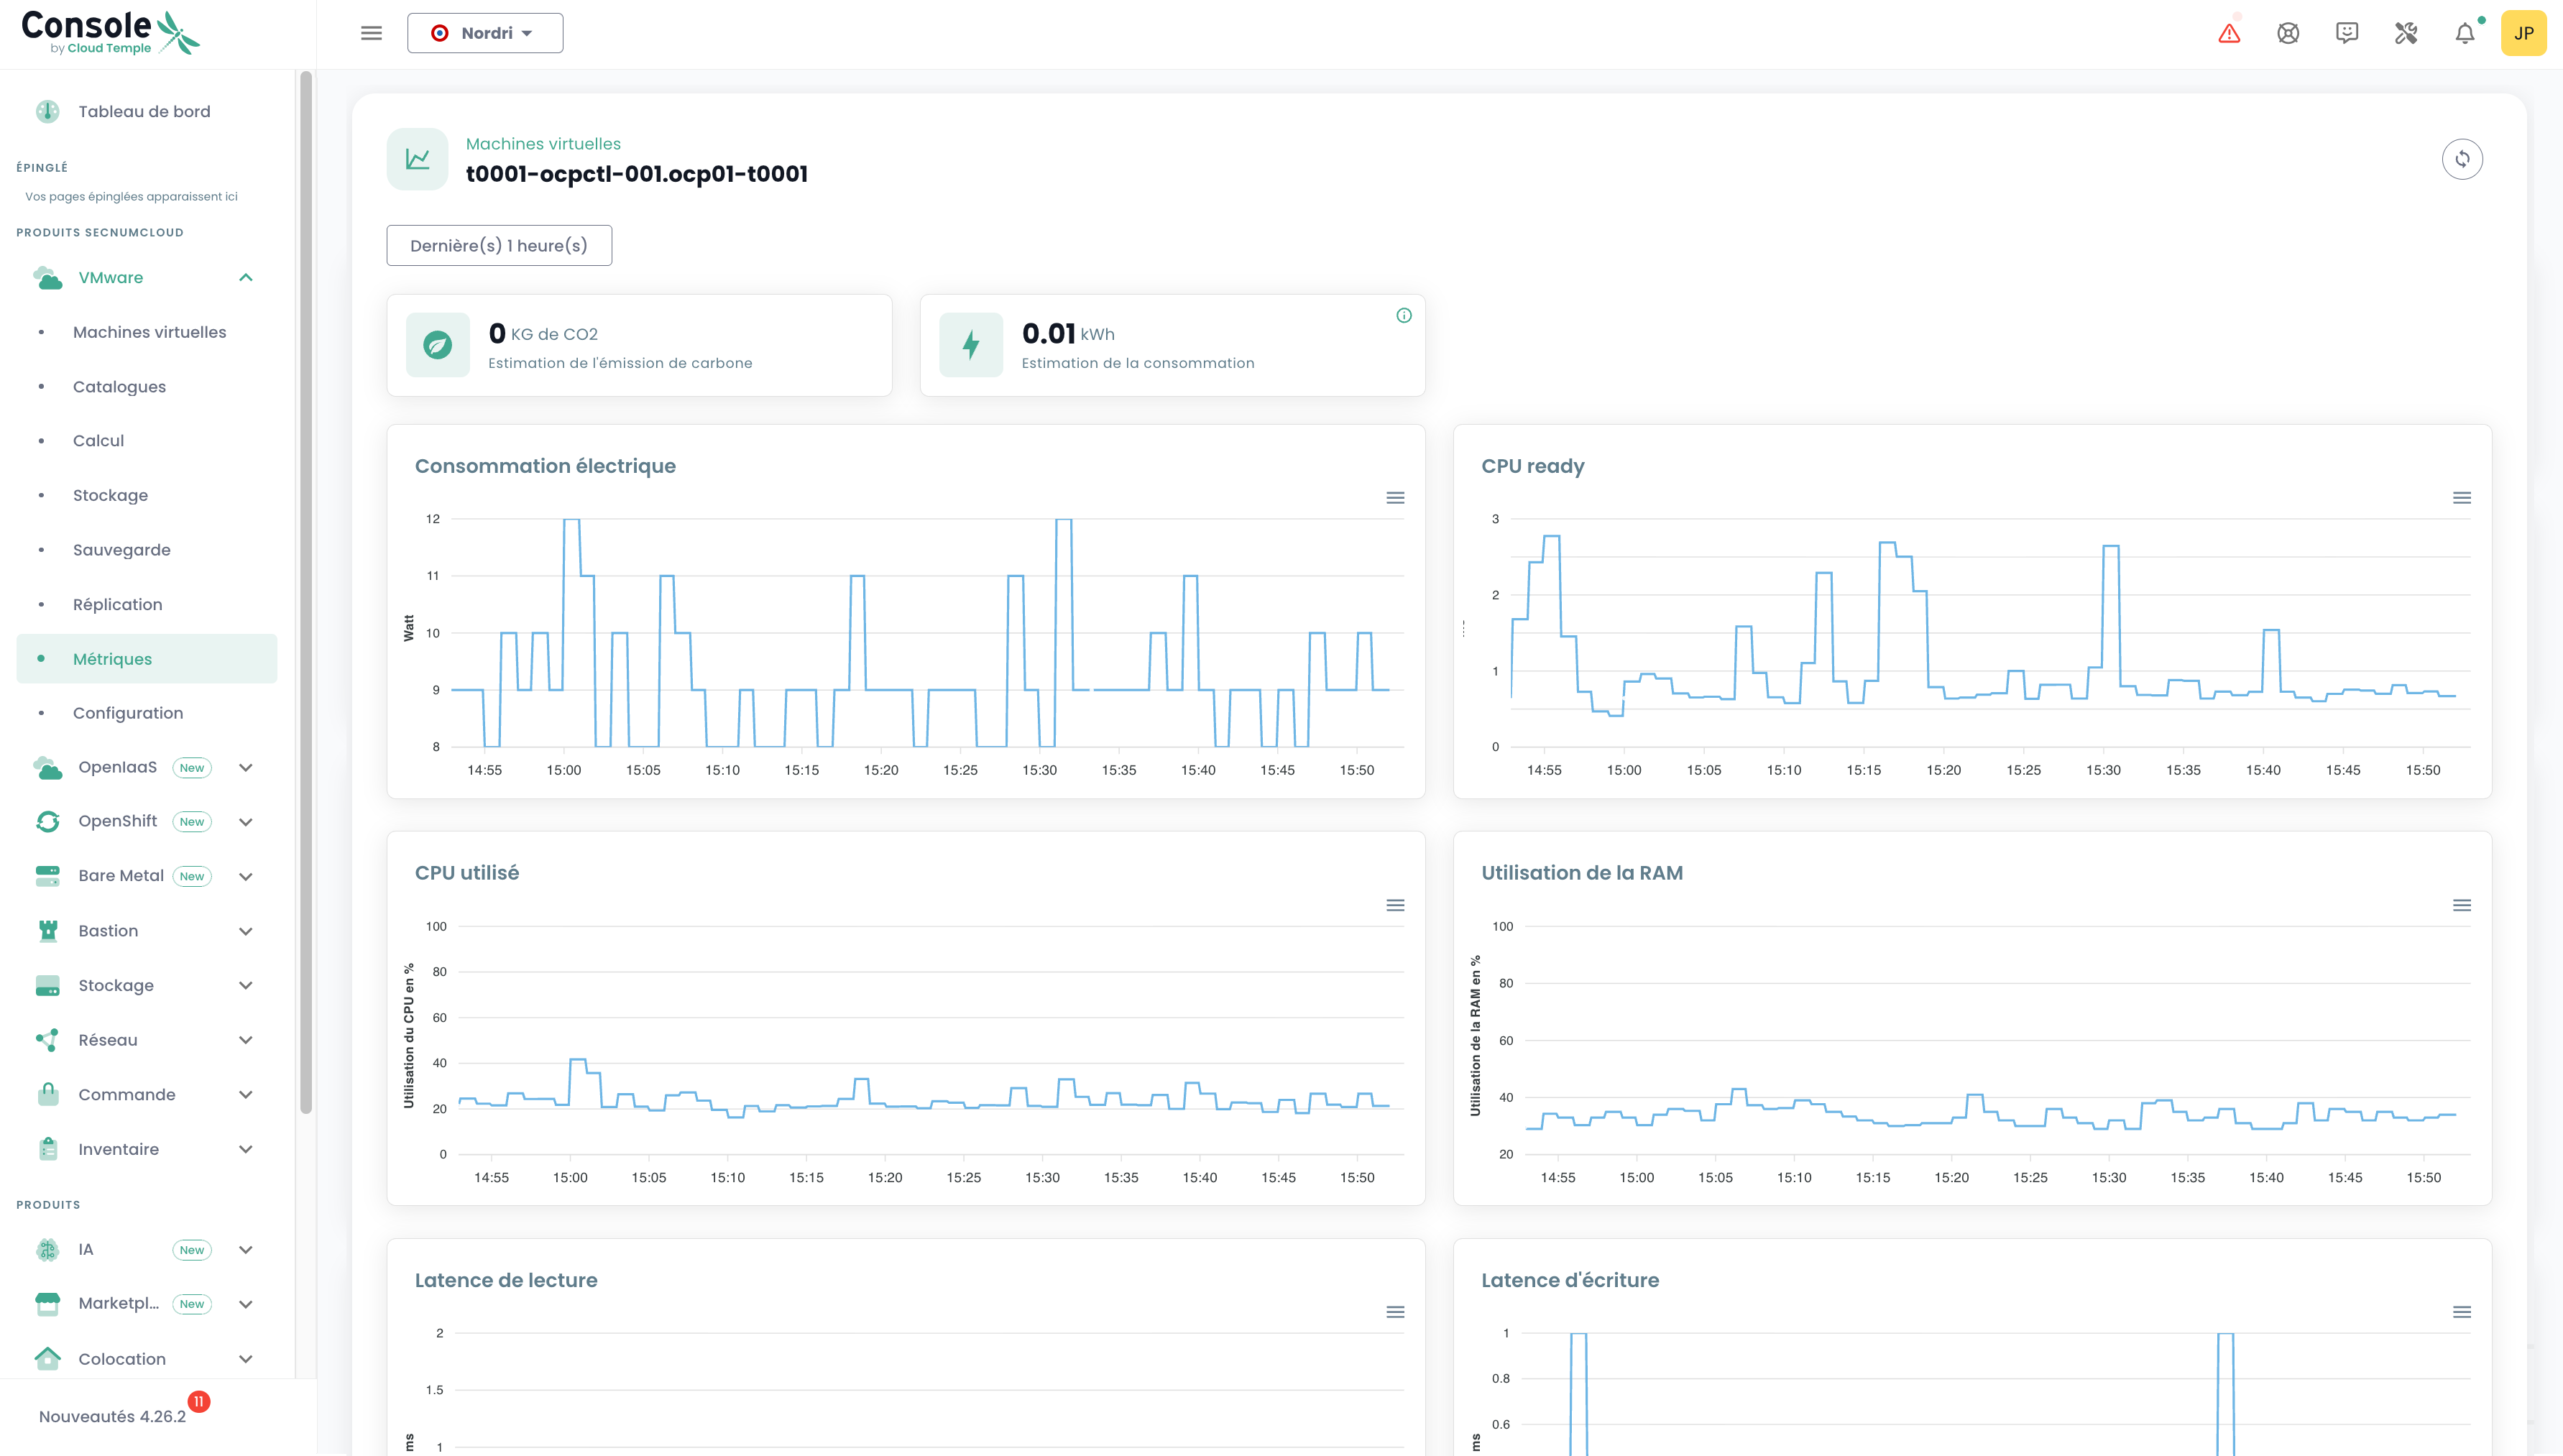
Virtual Machines
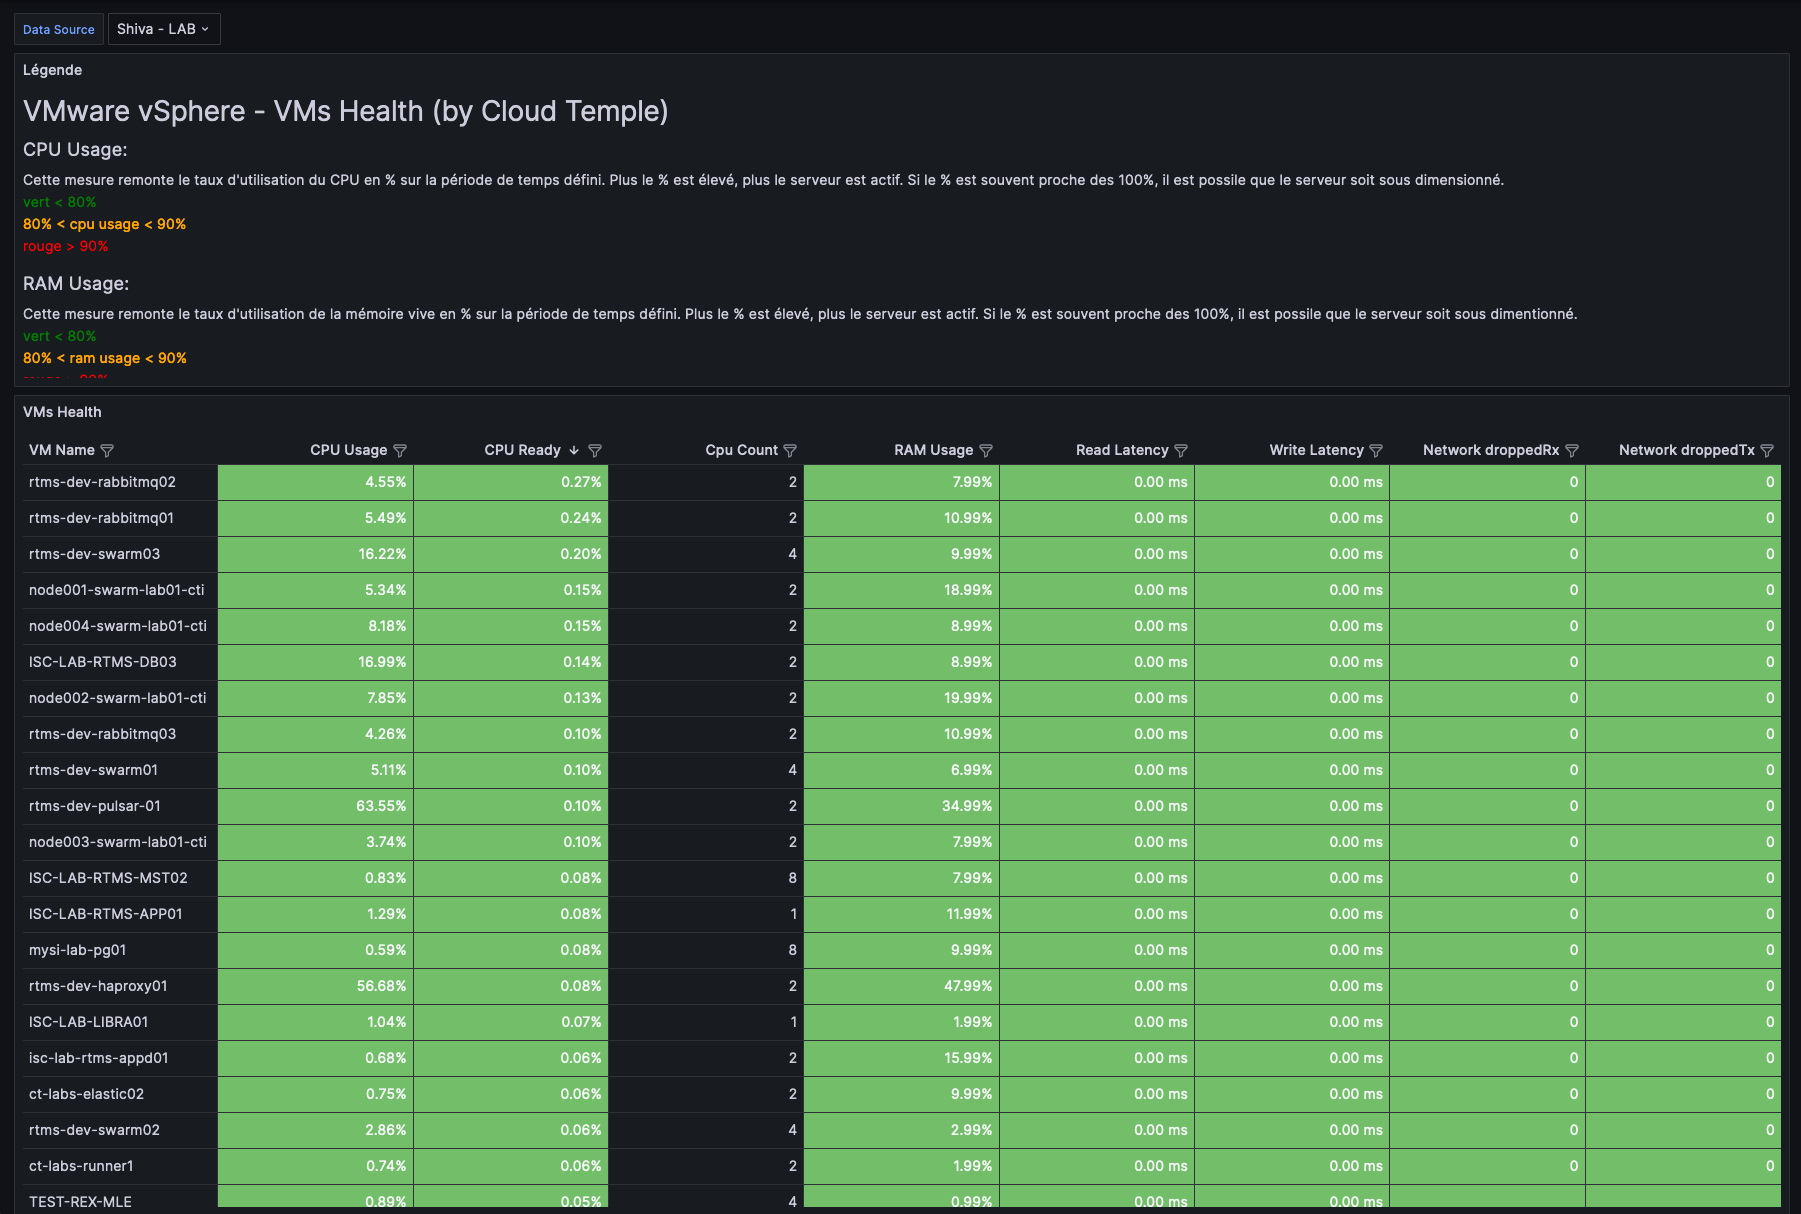
Here you can find a global view of virtual machine health.
This summary provides, for the selected time range:
- the number of CPUs and the average CPU utilization,
- the amount of memory in GB and the average memory usage,
- the average storage access latency for read and write operations,
- the average 'CPU Ready' for the virtual machine (ce qui correspond au temps moyen d'attente de disponibilité d'un core physique par la machine virtuelle).
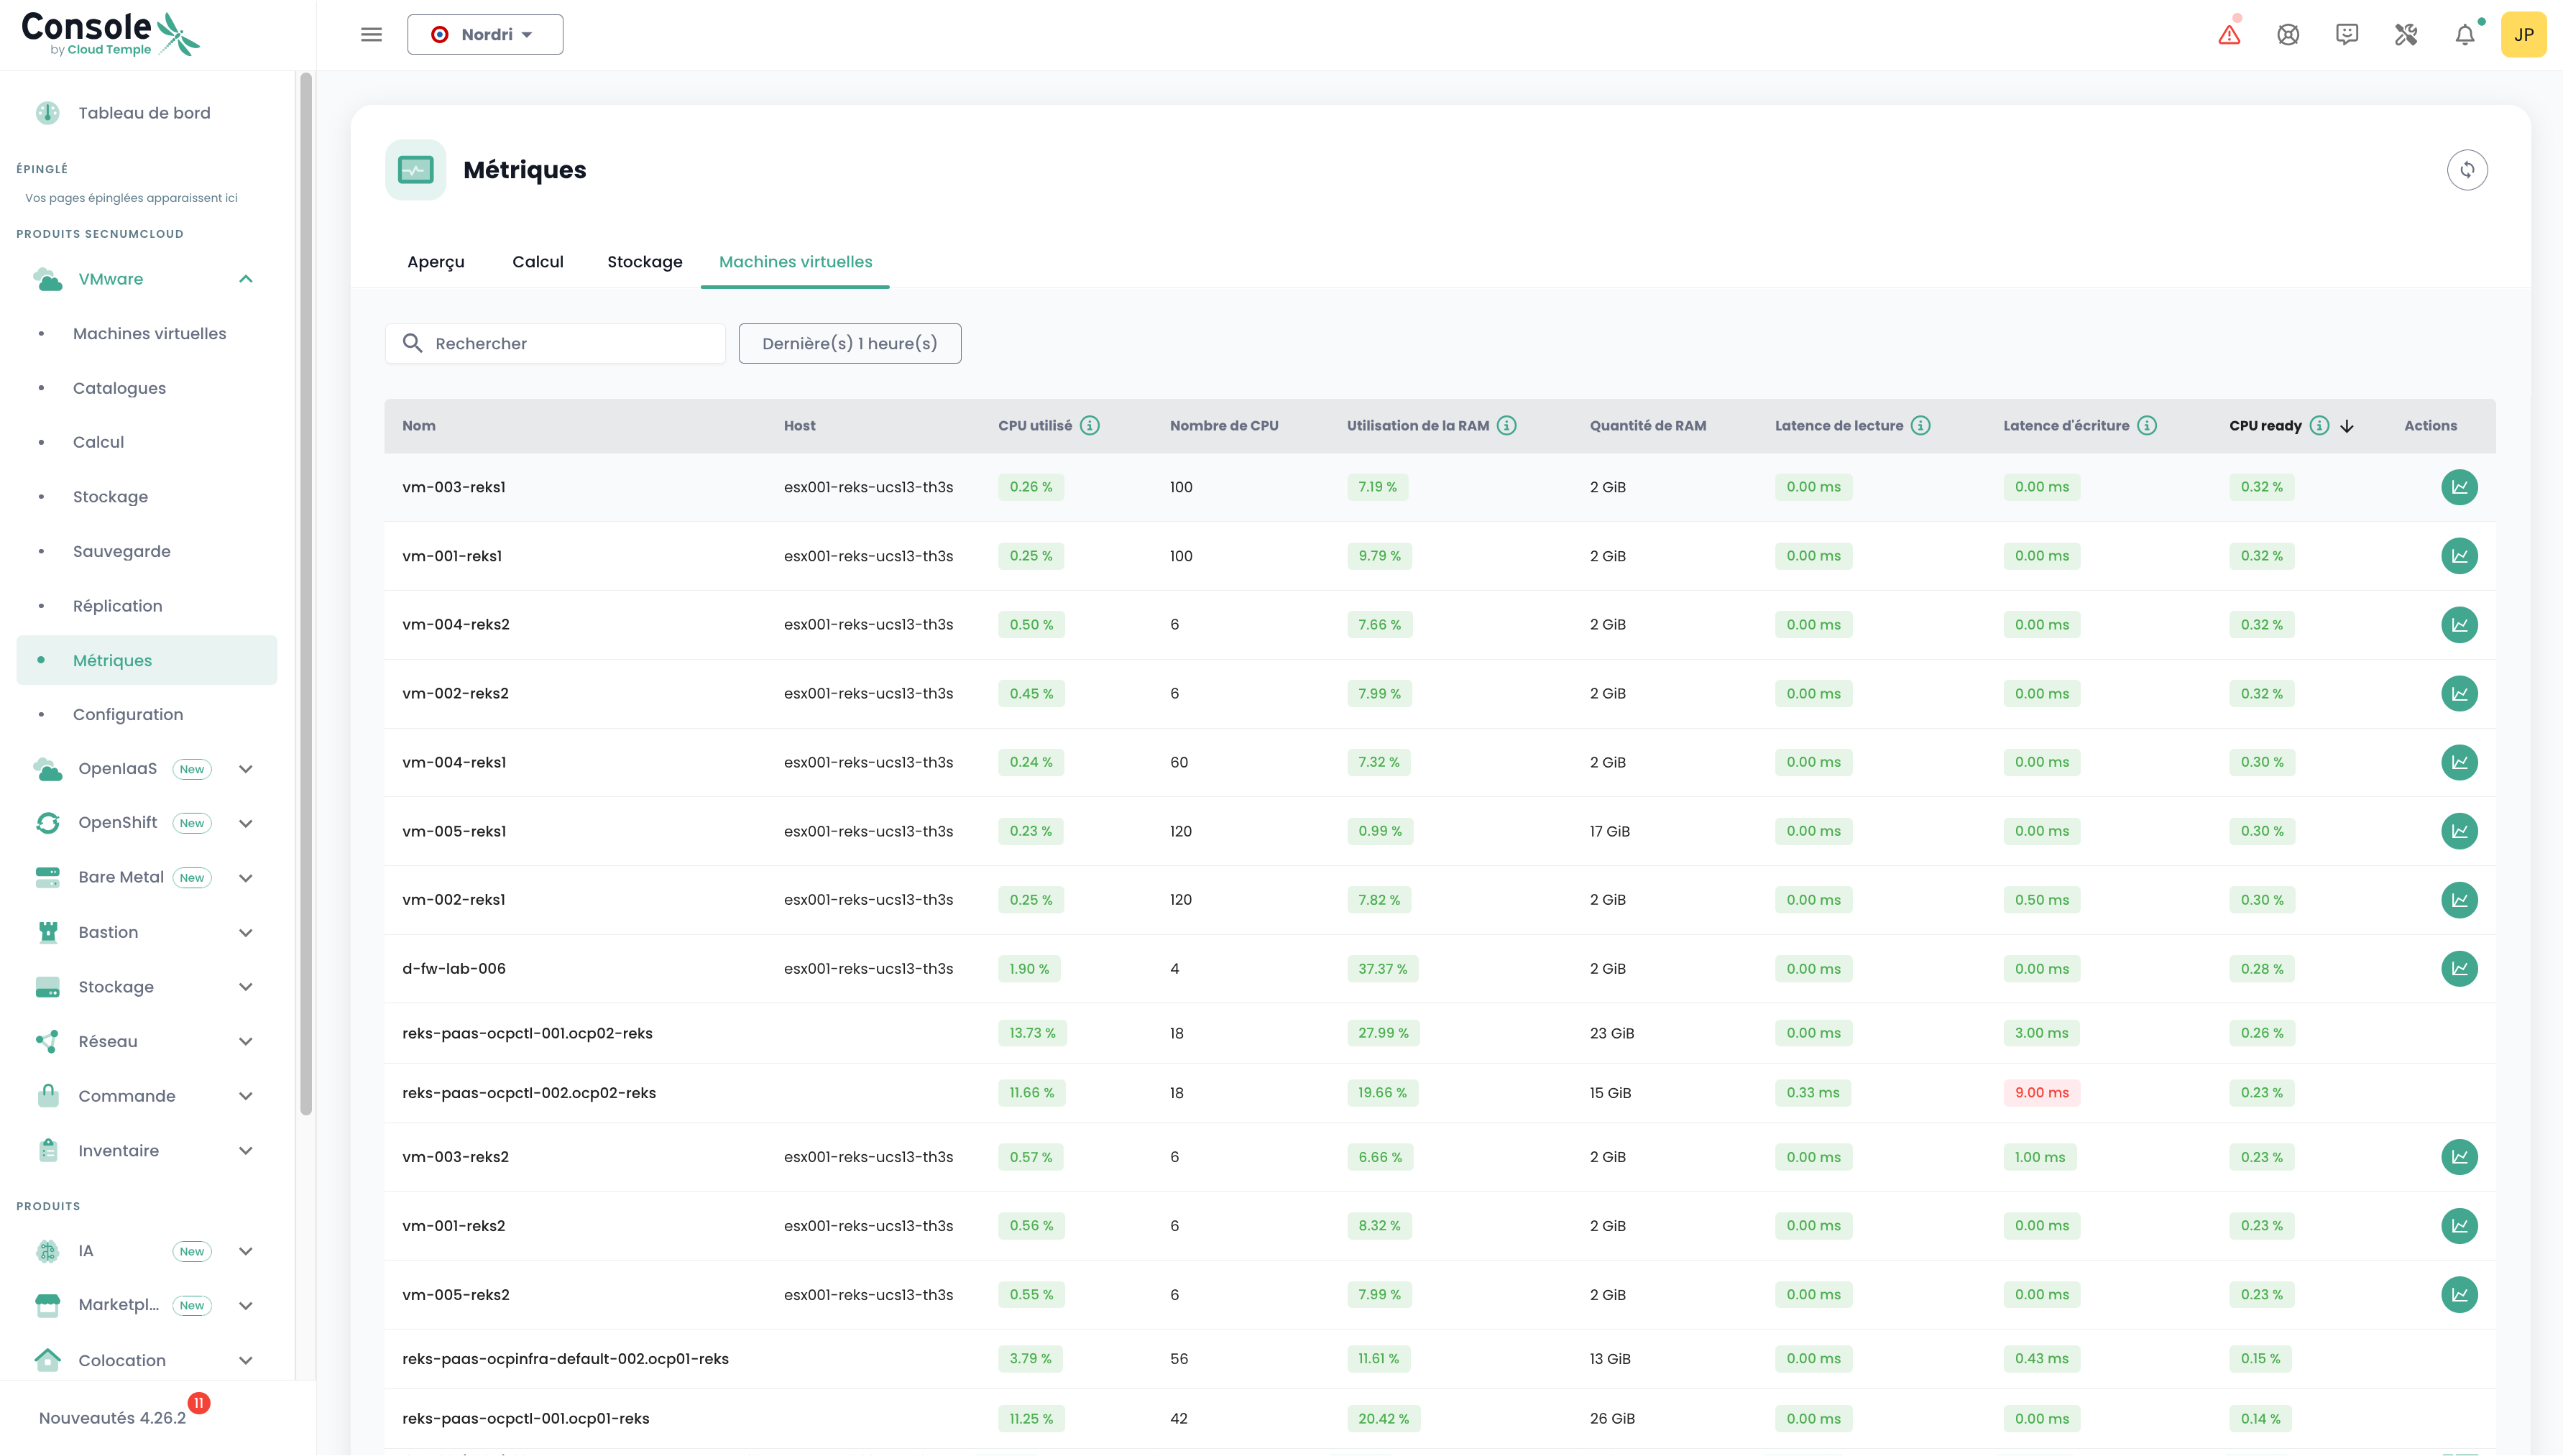
For each VM, you can access its performance history by clicking the green 'History' icon of the virtual machine in the action column. :

You are then taken to the graphical visualization page for historical data, including an environmental performance view :
VMware Metrics - View by Resource
You can also view a portion of the metrics related to VMware, but this time more specifically for a given Host or Datastore.
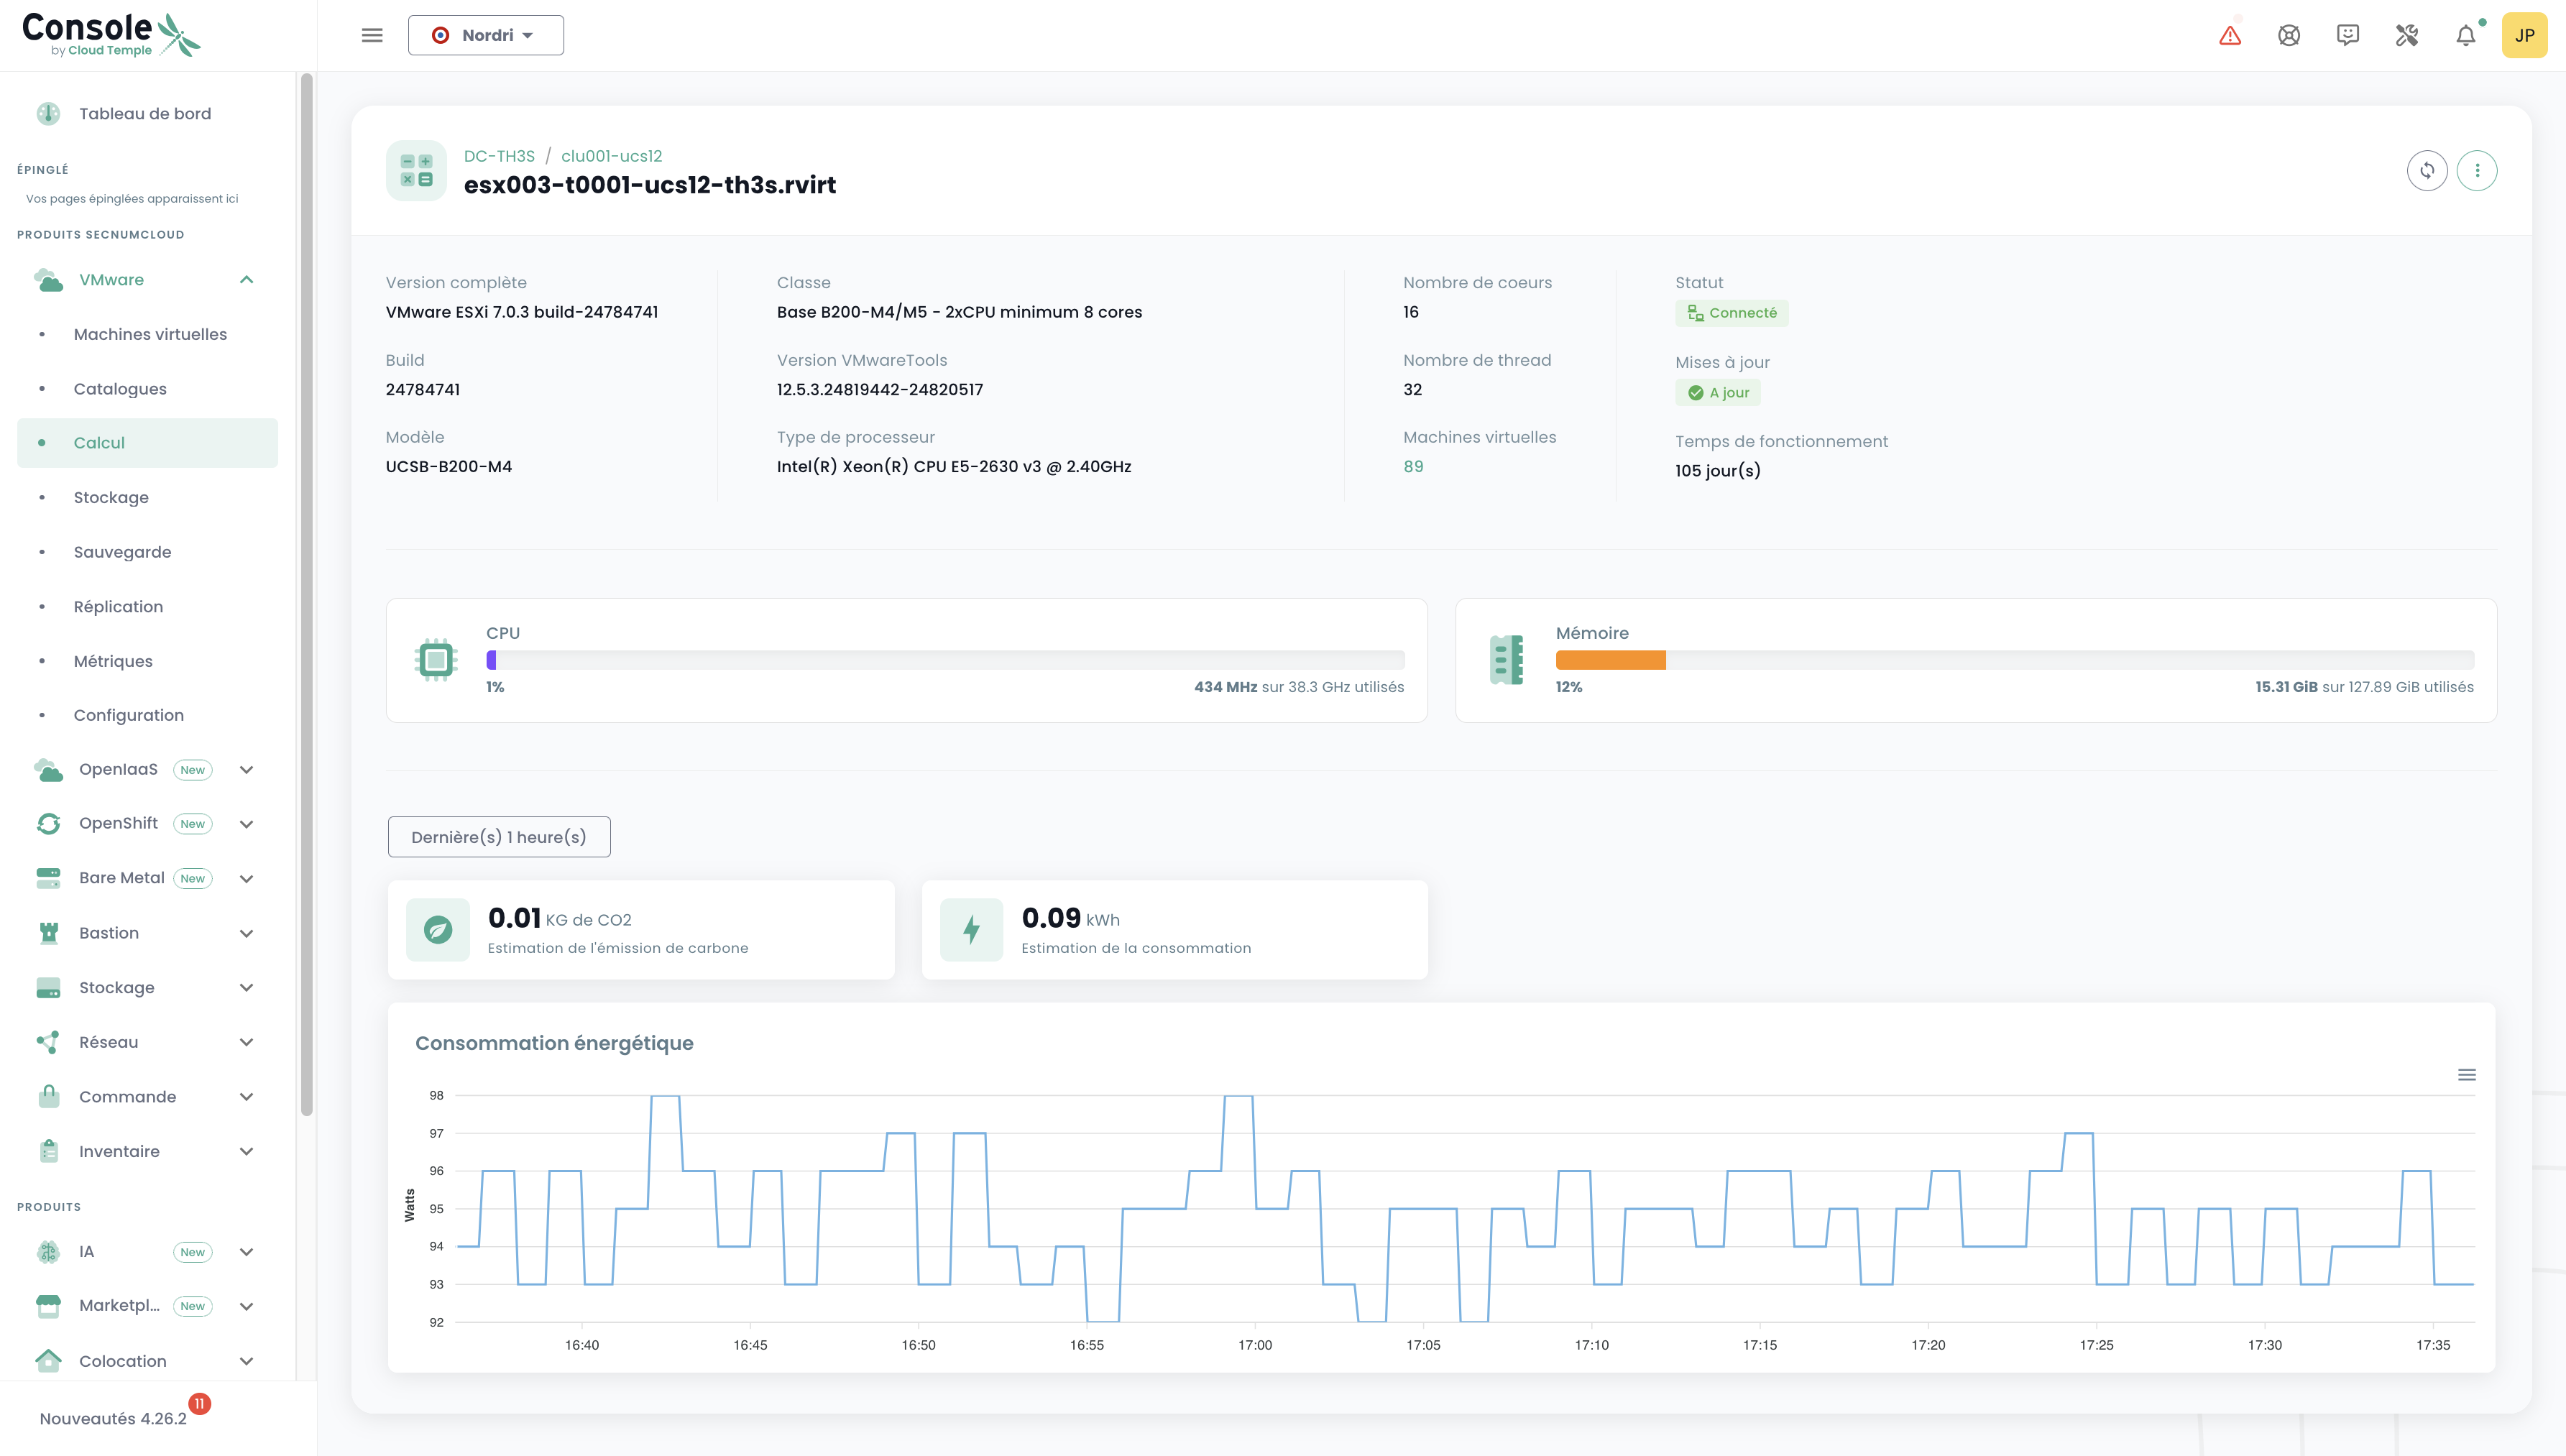
Host
In the Host view, you can view, for a given period, the energy consumption as well as the estimated carbon emissions.
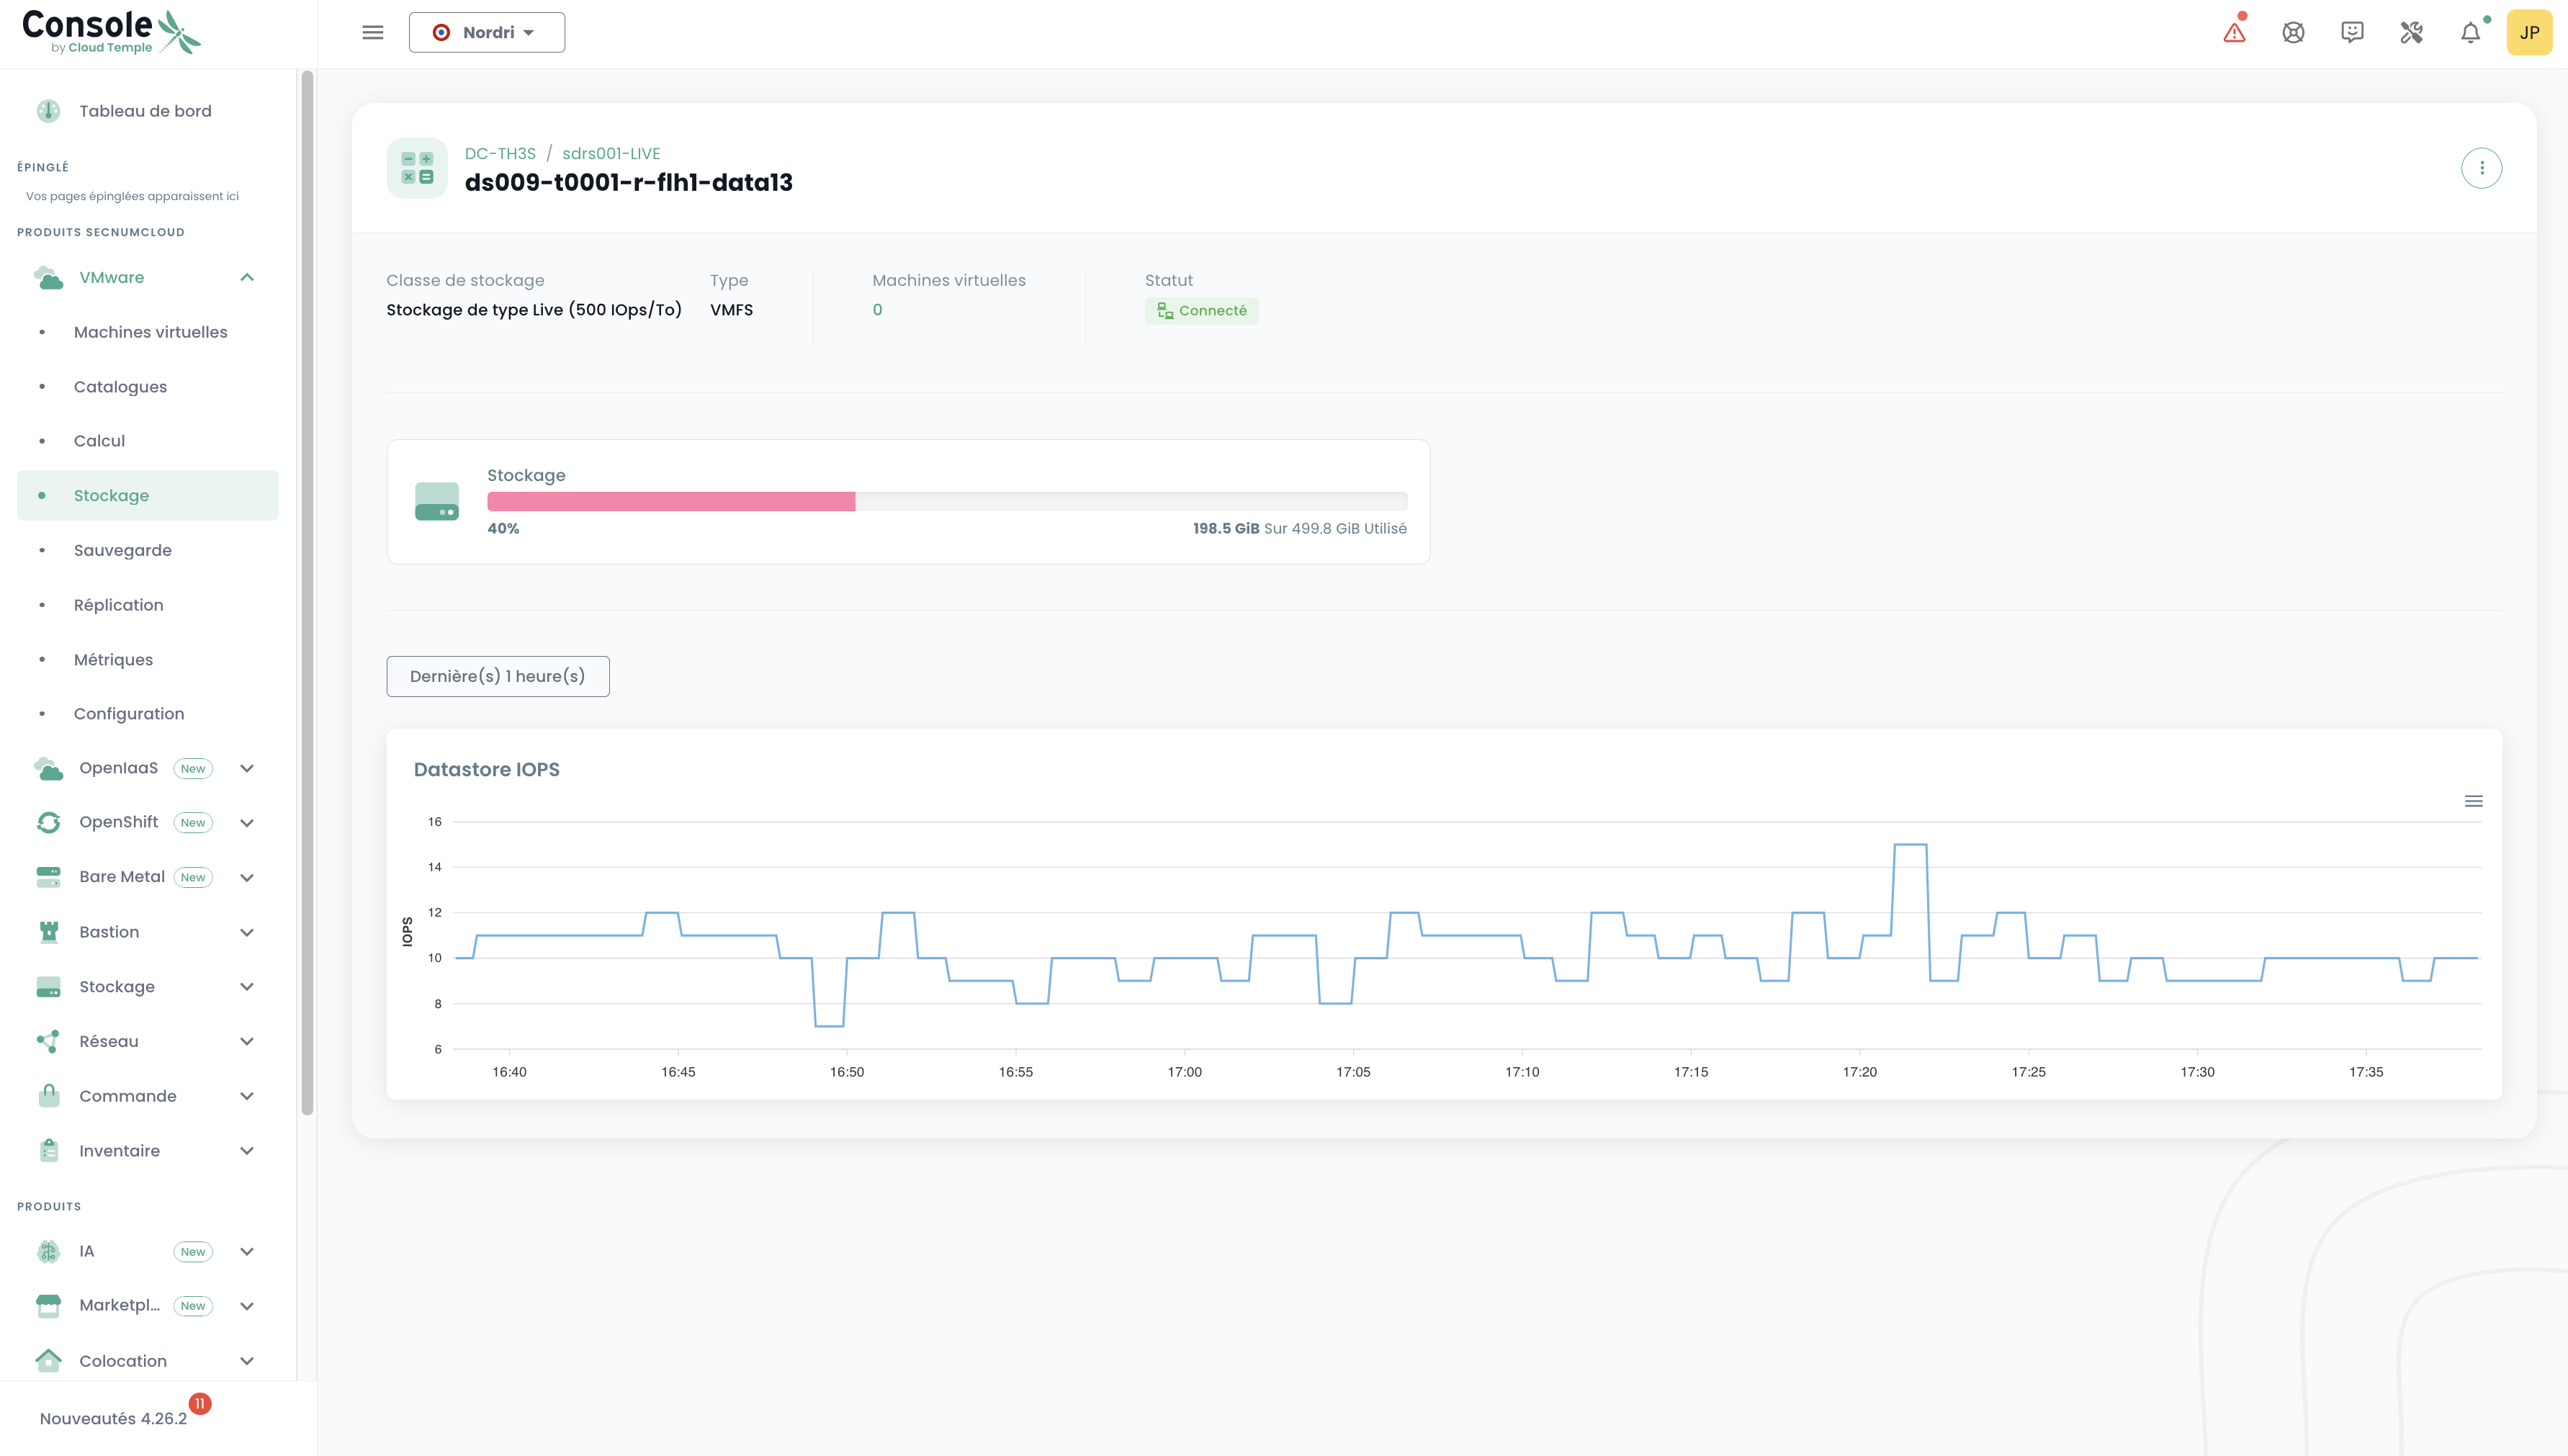
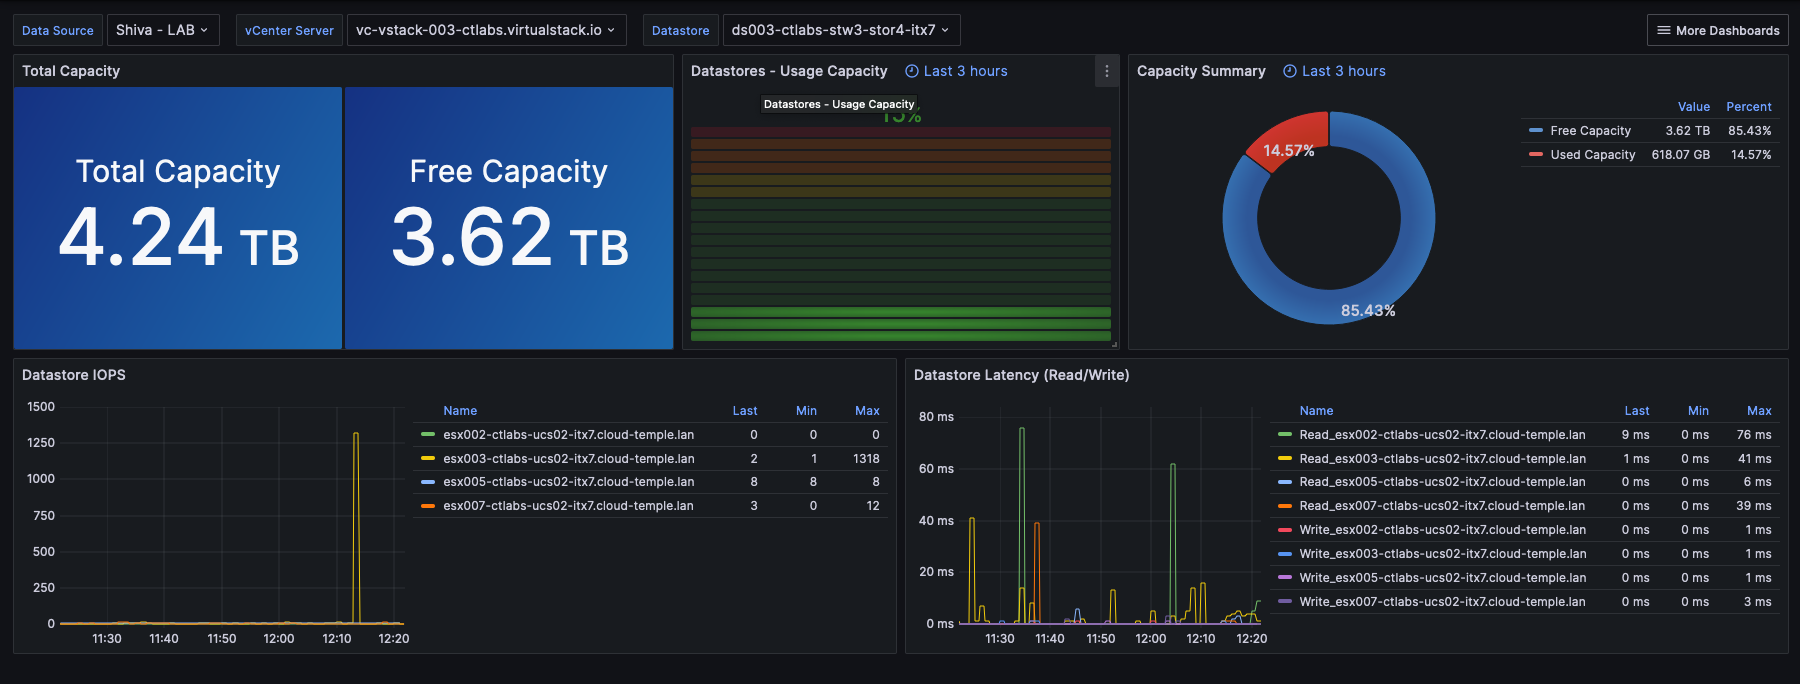
Datastore
In the Datastore view, you can view IOPS for a given period.
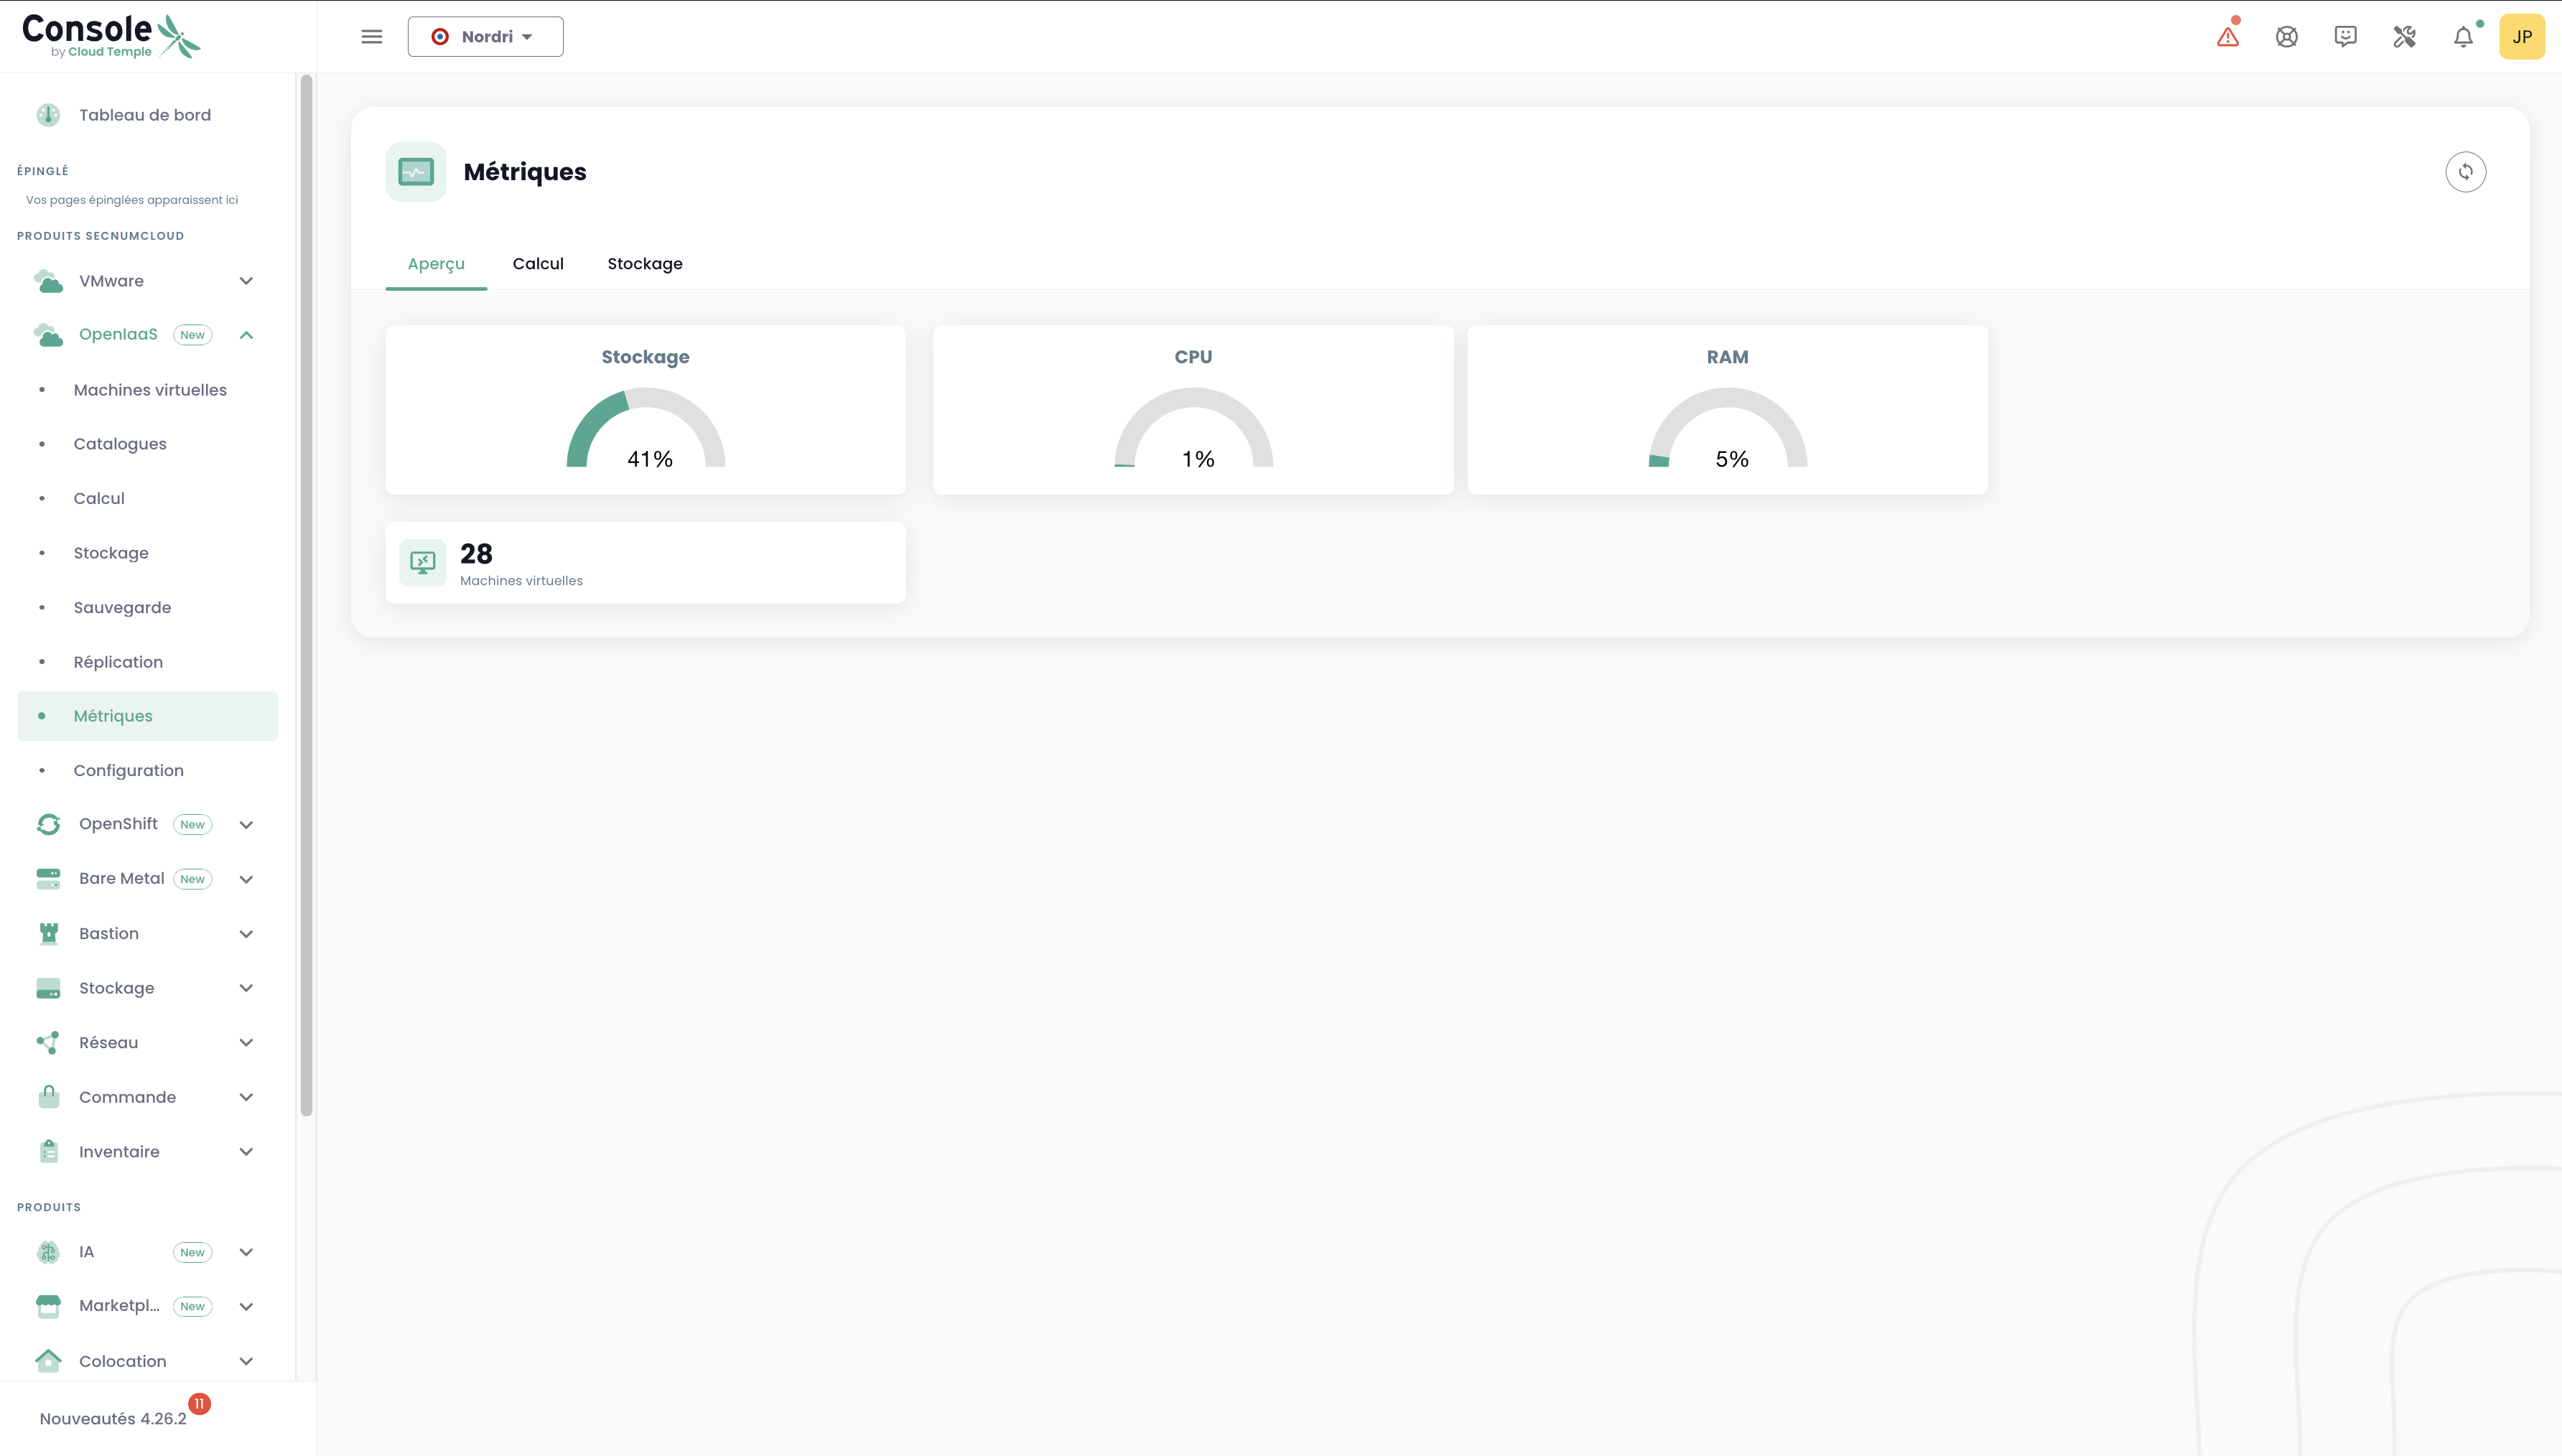
OpenIaaS Metrics
In the 'OpenIaaS' menu, a specific dashboard is available in the 'Metrics' submenu. It includes 3 tabs:
Overview
On this tab, you will find a portion of the metrics already present in the global dashboard discussed at the beginning of this chapter.
Compute
On this tab, you will find the number of AZ, Clusters, and Hosts, along with 5 charts providing a highly visual overview of your OpenIaaS environment.
You can choose the date range to cover, as well as the data grouping type (by default, data is grouped across your entire scope). For example, selecting Host:
Storage
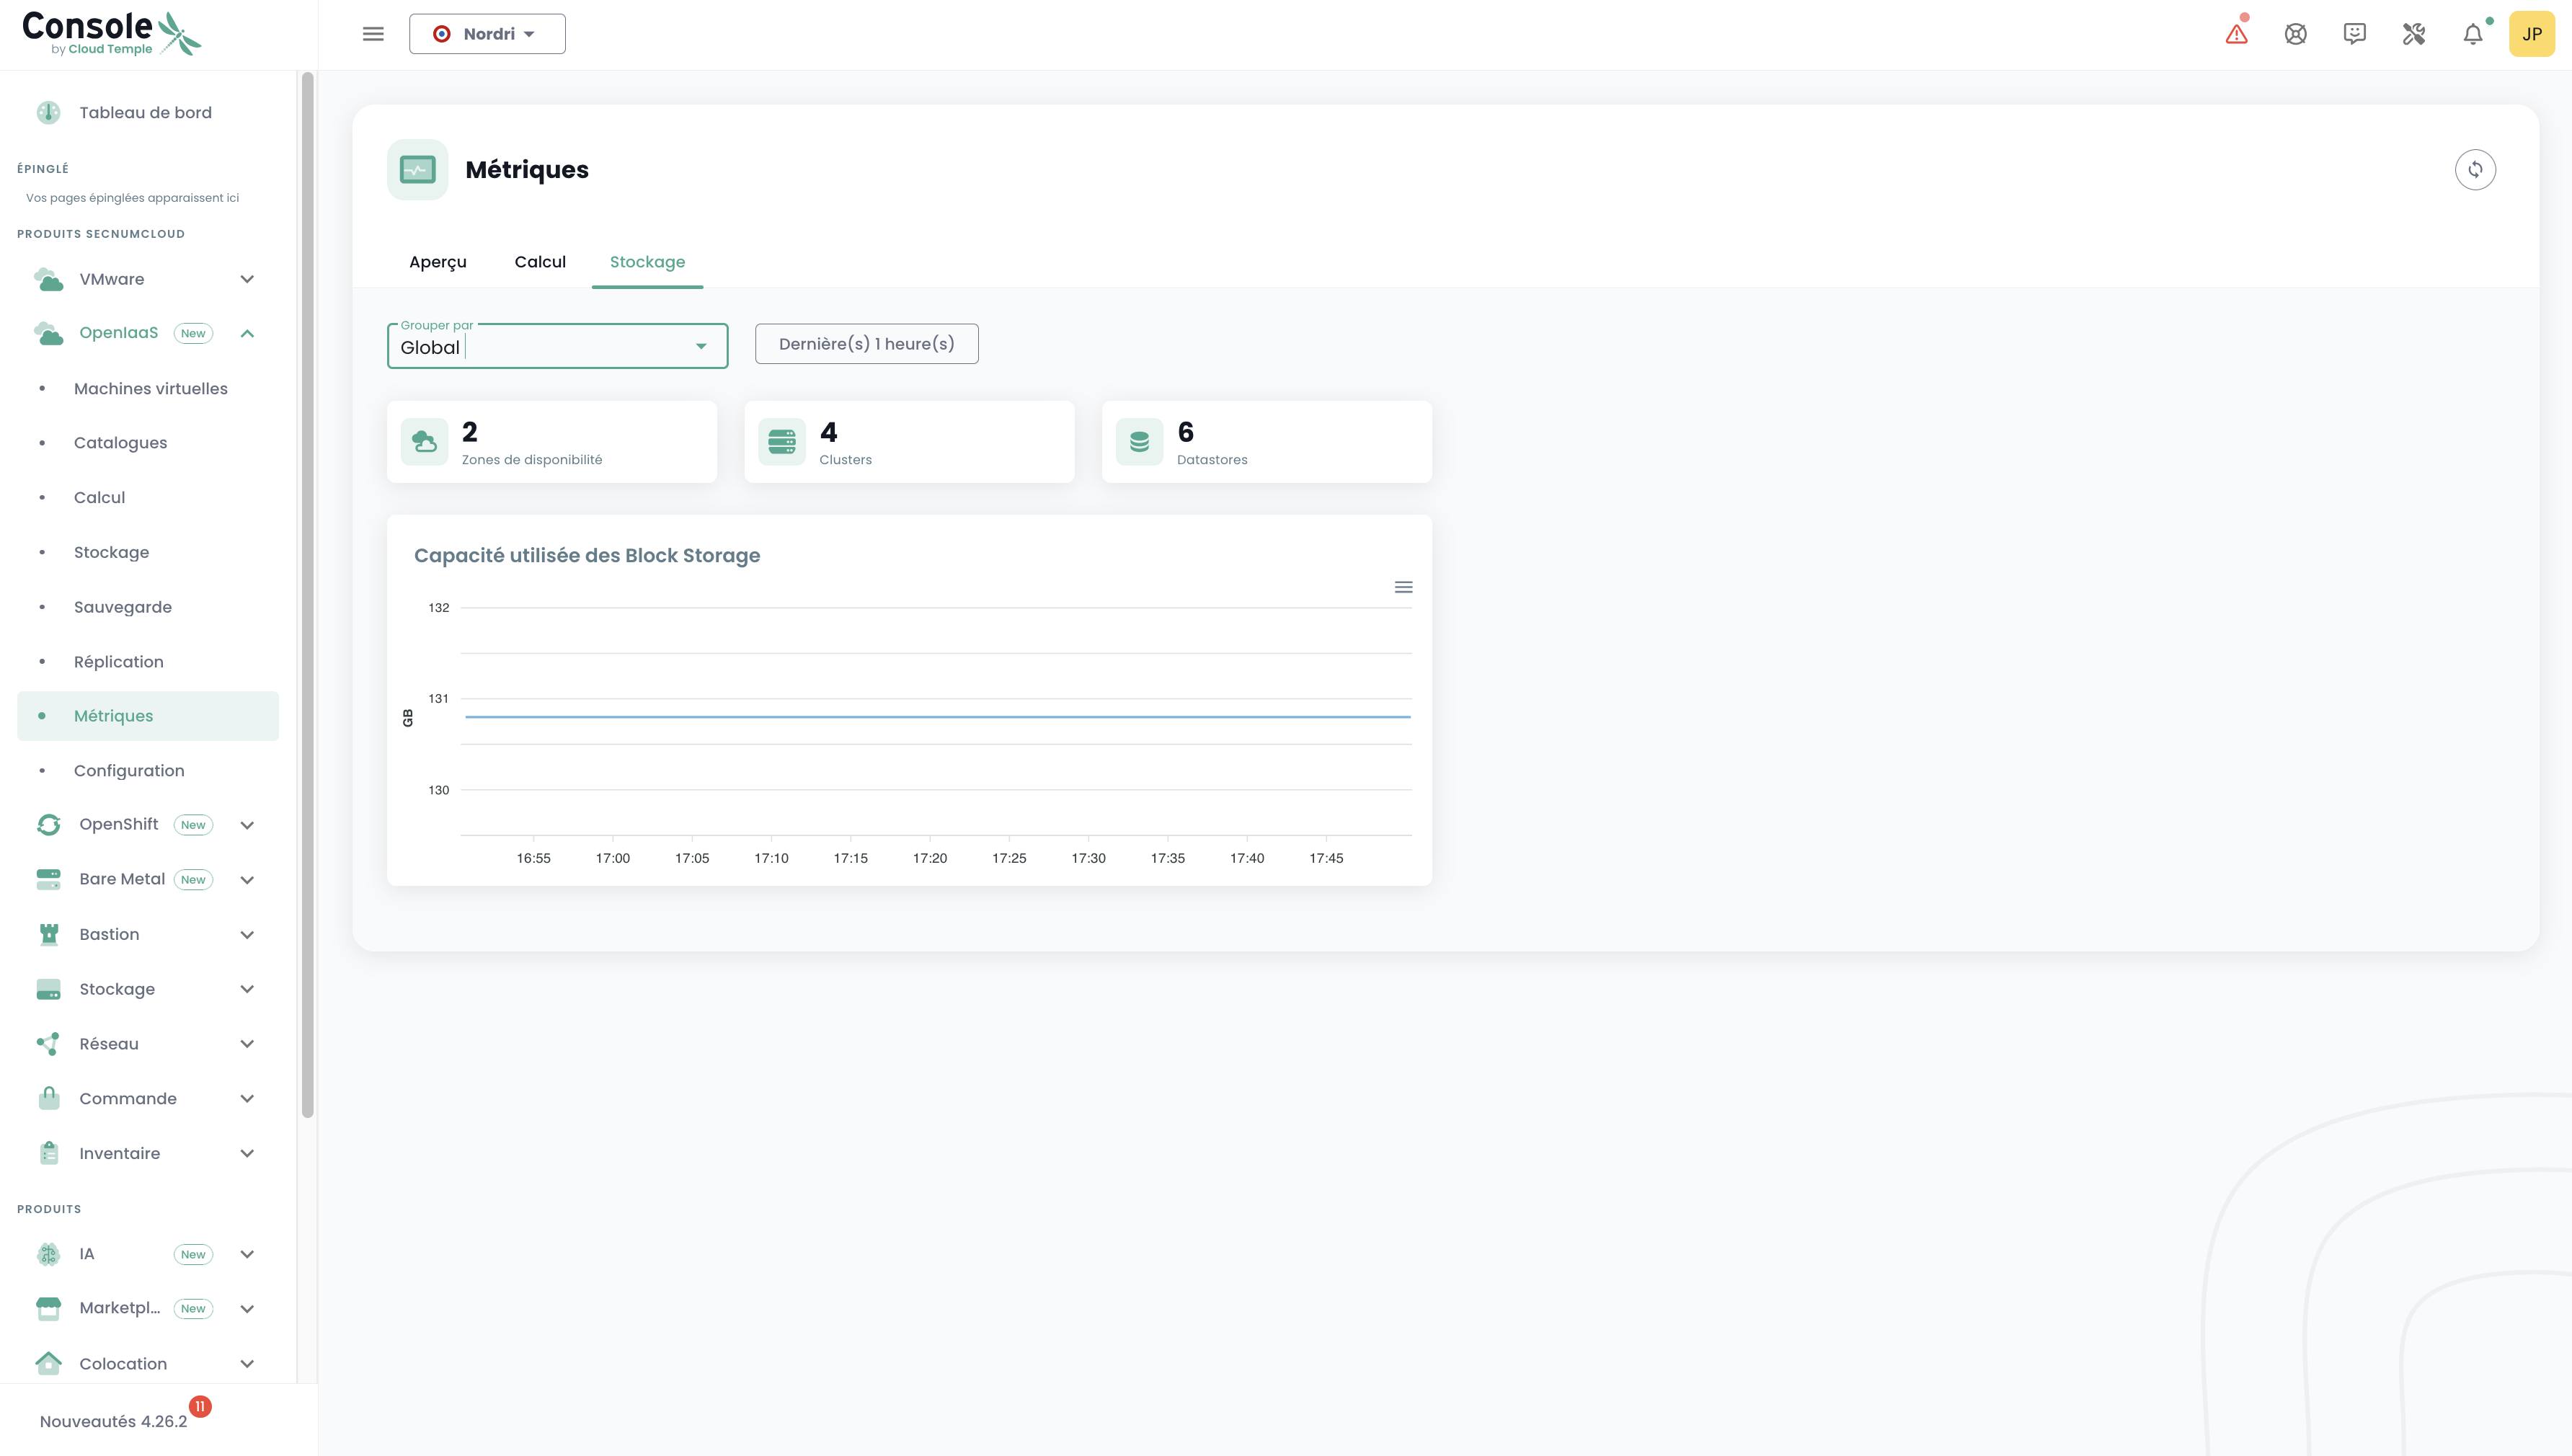
Similarly to the "Compute" tab, you will find various information: the number of AZs, Clusters, Datastores as well as a chart. The same filtering principle applies, but here, we can group by Block Storage.
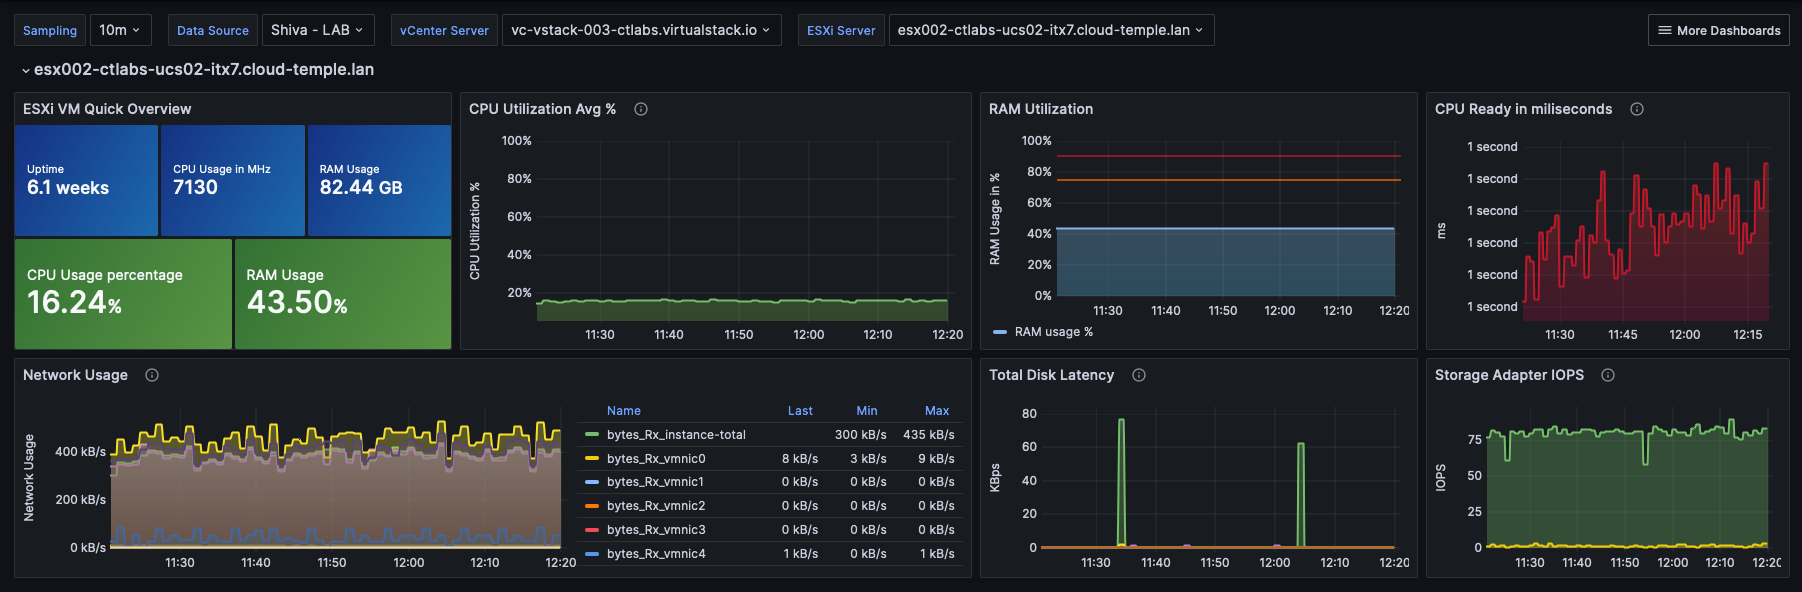
Usage with Grafana
Console Integration with Grafana
The Cloud Temple Console can be used as a datasource for your Grafana infrastructure.
The console is Prometheus-compatible, enabling you to add it to Grafana as a Prometheus-type datasource. This allows you to:
- Visualize all your metrics.
- Create your own custom dashboards tailored to your needs.
Cloud Temple also provides a collection of dashboards ready-to-use, which you can use as a base or adapt to your specific use cases.
Configure the Console as a data source in Grafana
The goal is to enhance the observability of your Cloud infrastructure via Cloud Temple telemetry.
Prerequisites
- A Grafana instance with access to the Console APIs.
- Administrative access to the Grafana instance to configure the datasources.
- A personal access token with at least the
metrics_readpermission.
Configuration
In Grafana's configuration, go to the "datasources" tab and click "Add datasource".
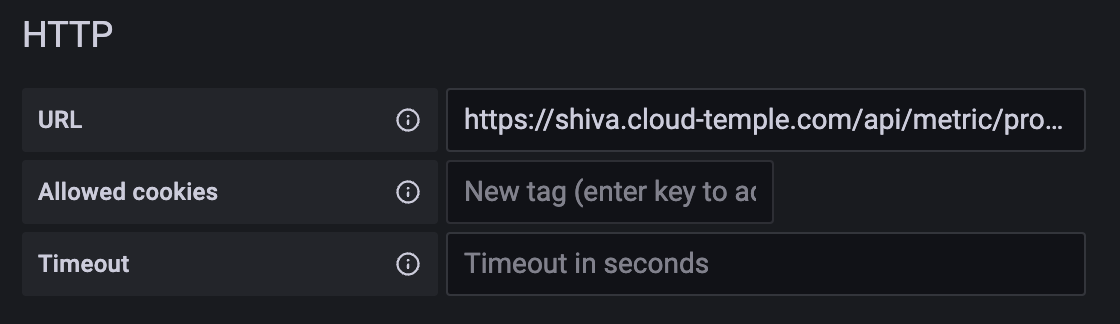
In the URL, provide the Console Metrics API URL without the version and ending with "/prometheus" (example: https://shiva.cloud-temple.com/api/metric/prometheus)
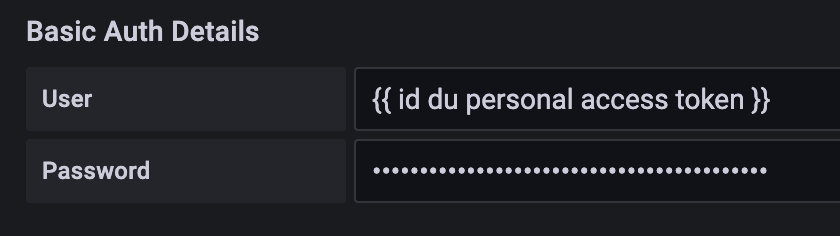
In authentication, enable the Basic Auth option.
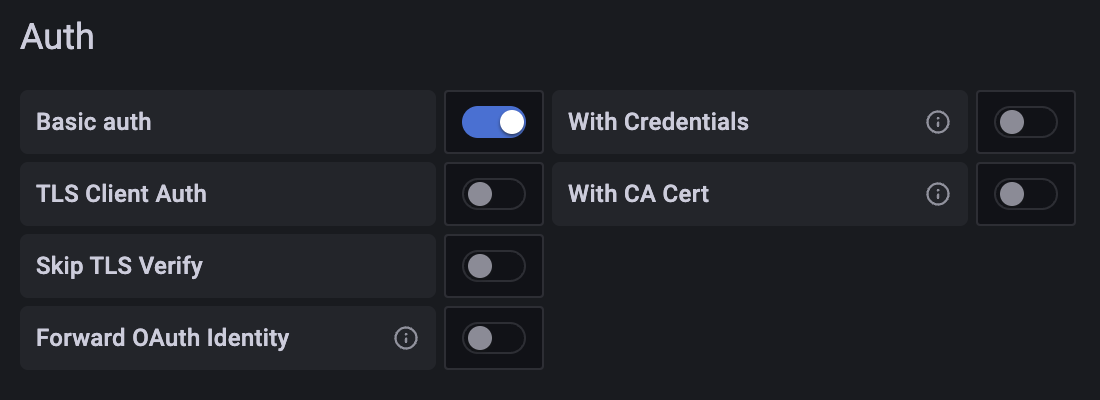
In the "Basic Auth Details" section, configure the username and password using the id and secret of a Personal Access Token with the metrics_read permission, respectively.
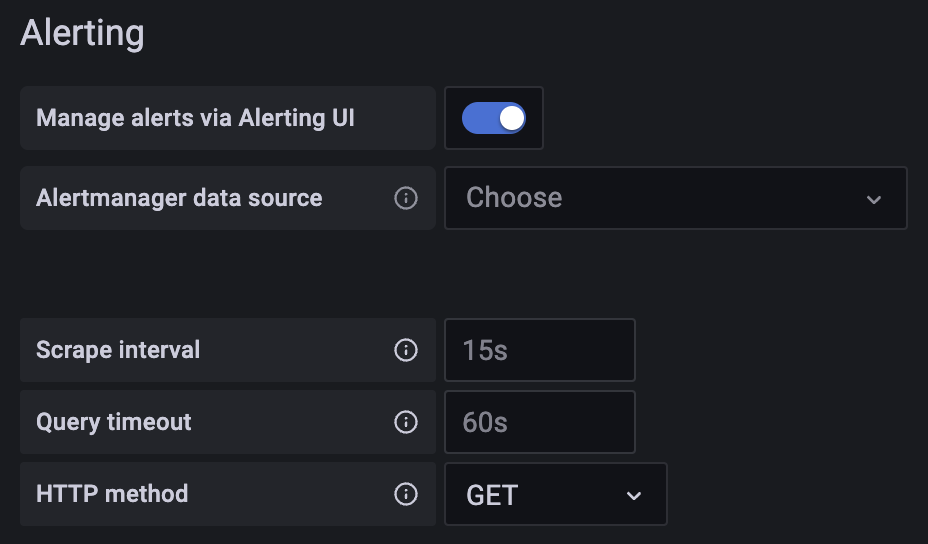
In the "Alerting" section, set the HTTP Method property to GET.
Result
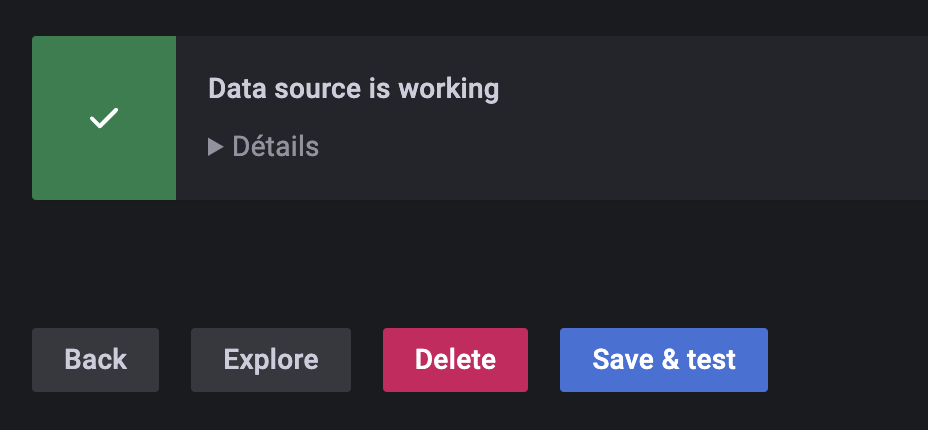
To confirm that the configuration is correct and functional, click the "Save & test" button.
You should see a banner appear informing you that the configuration was successful.
You will find a complete set of Grafana configuration examples here: https://github.com/Cloud-Temple/console-grafana-iaas