Quickstart
Prerequisites
- Have a Cloud Temple product subscription. To subscribe easily, you can contact us or email contact@cloud-temple.com.
- Have access to the Console
- Have your public IPv4 address registered in the Cloud Temple trusted zone (Console access is limited to identified trusted addresses)
Connecting to your Cloud Temple tenant
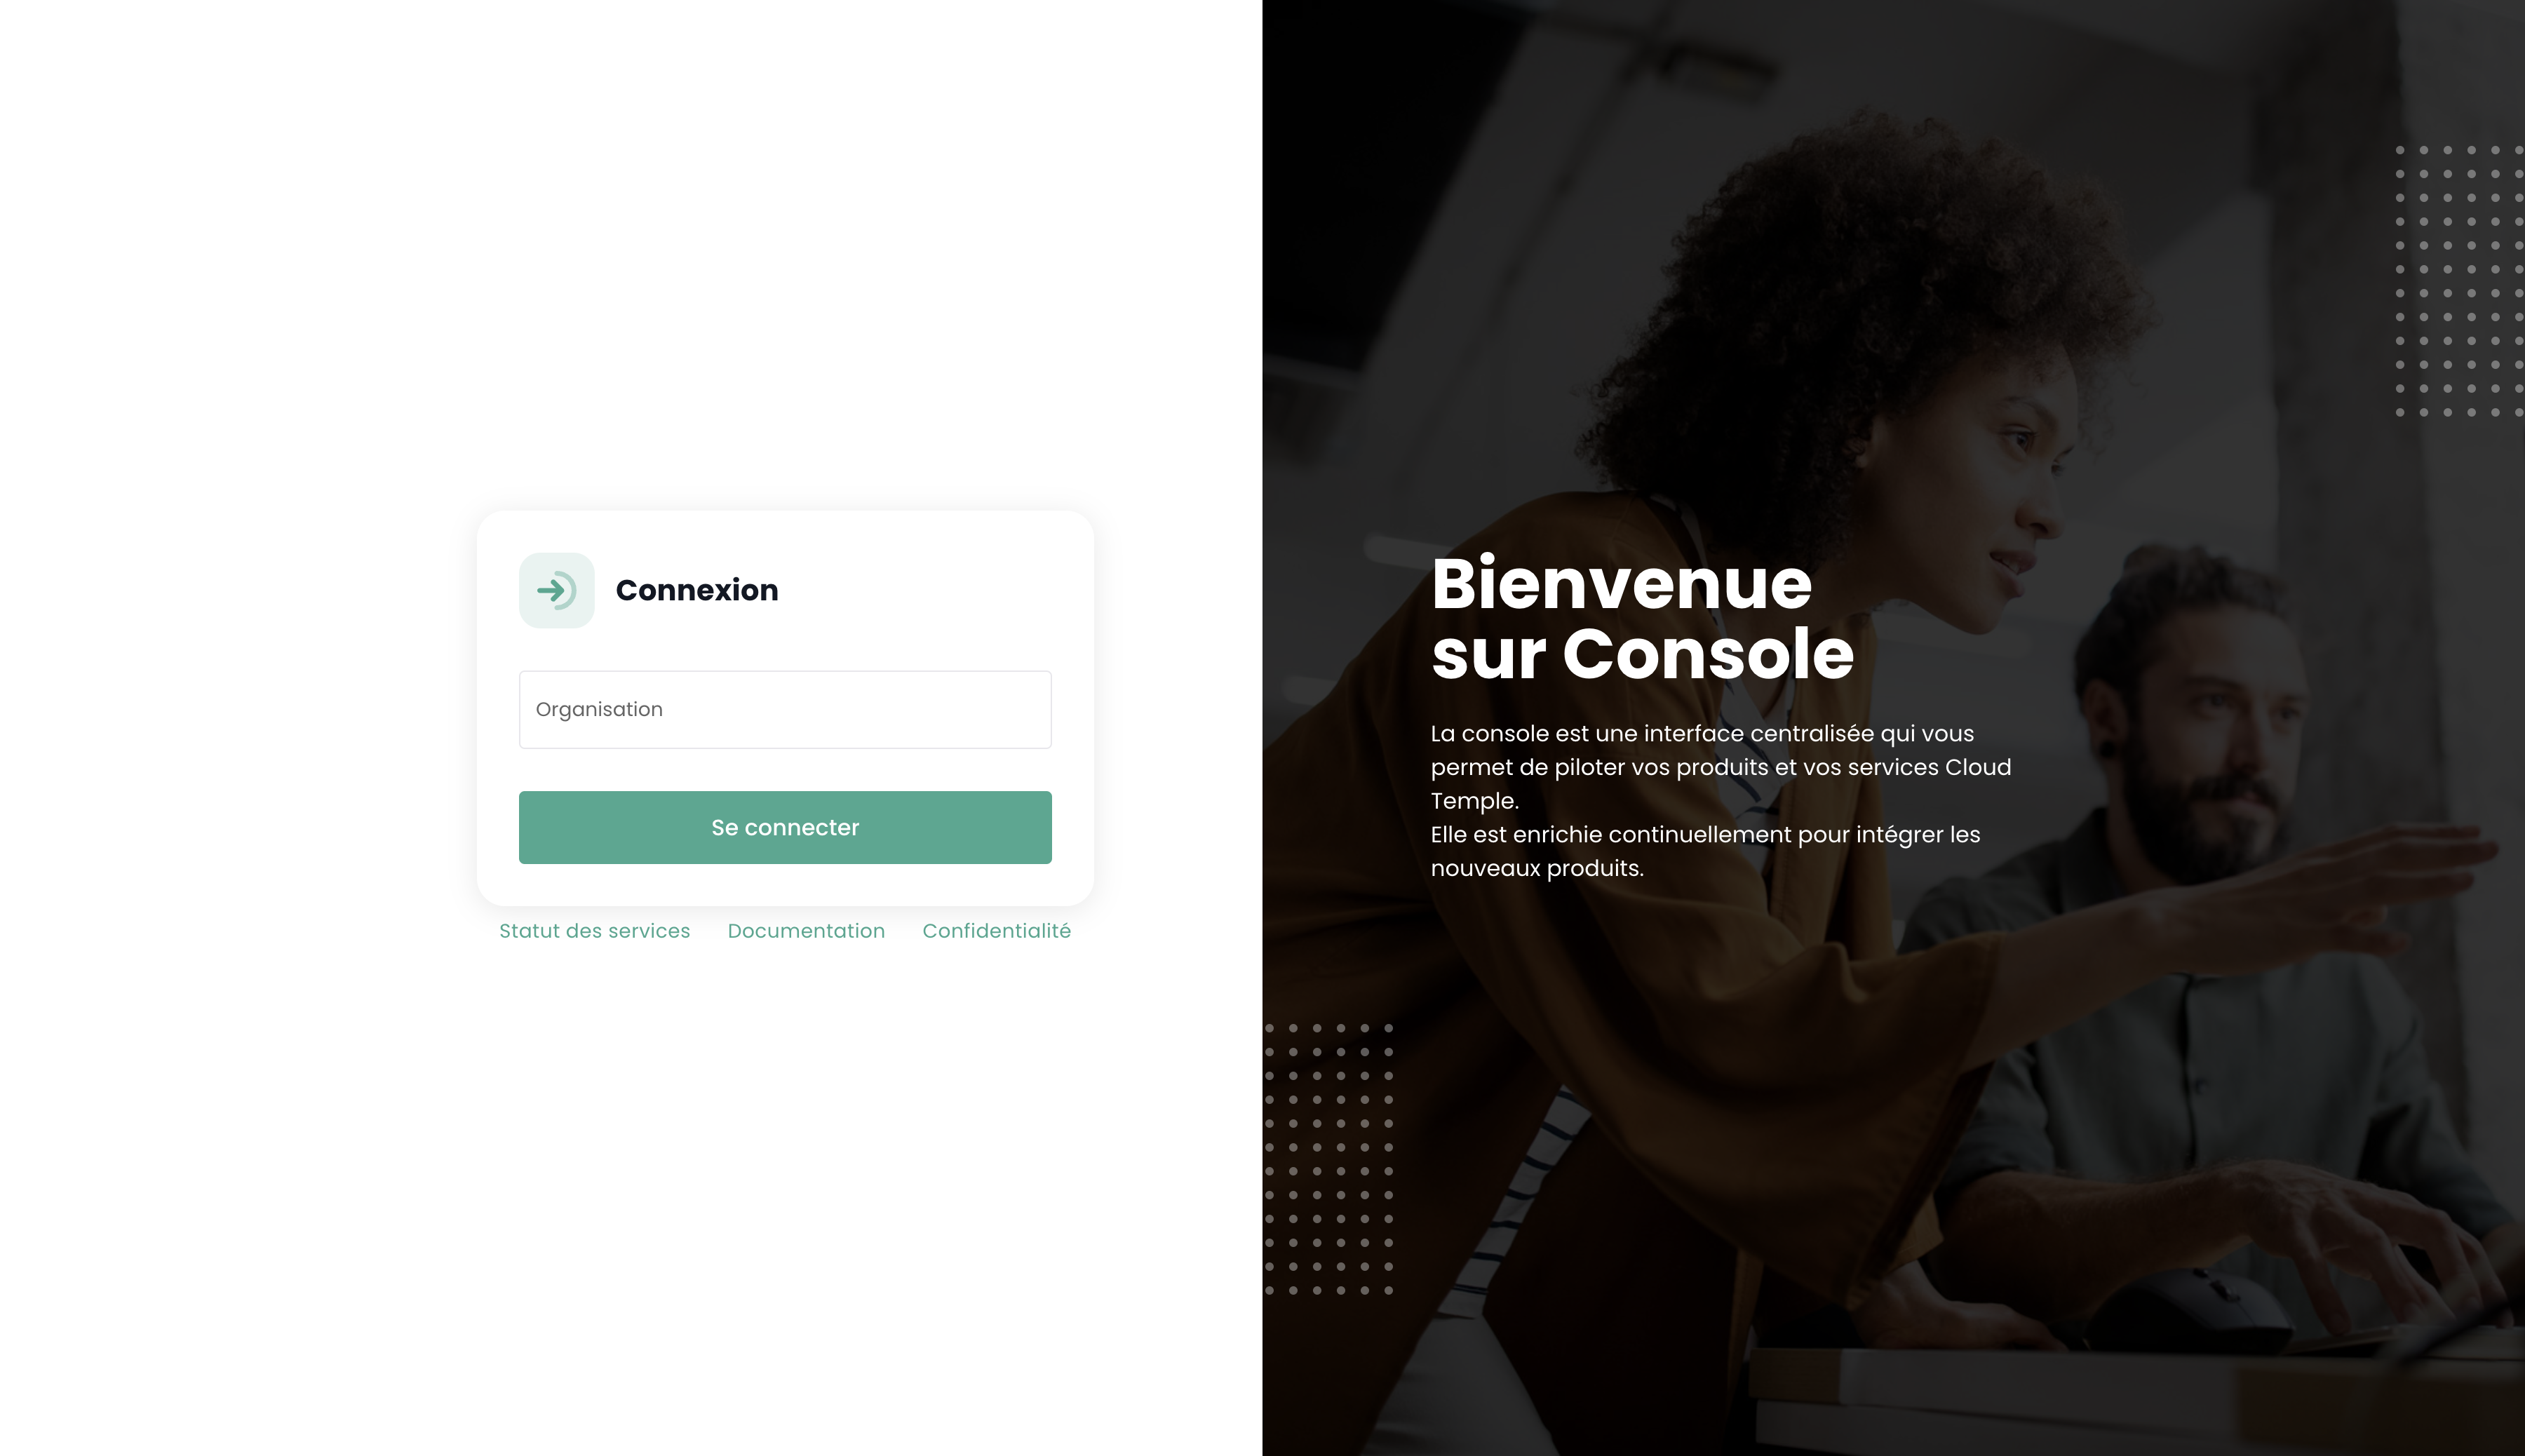
The Console is accessible via the URL below: Console or directly from the URL provided to you via email.
The first page allows you to select the organization in which your user was created. Once the company is entered, please click on 'Log in'.
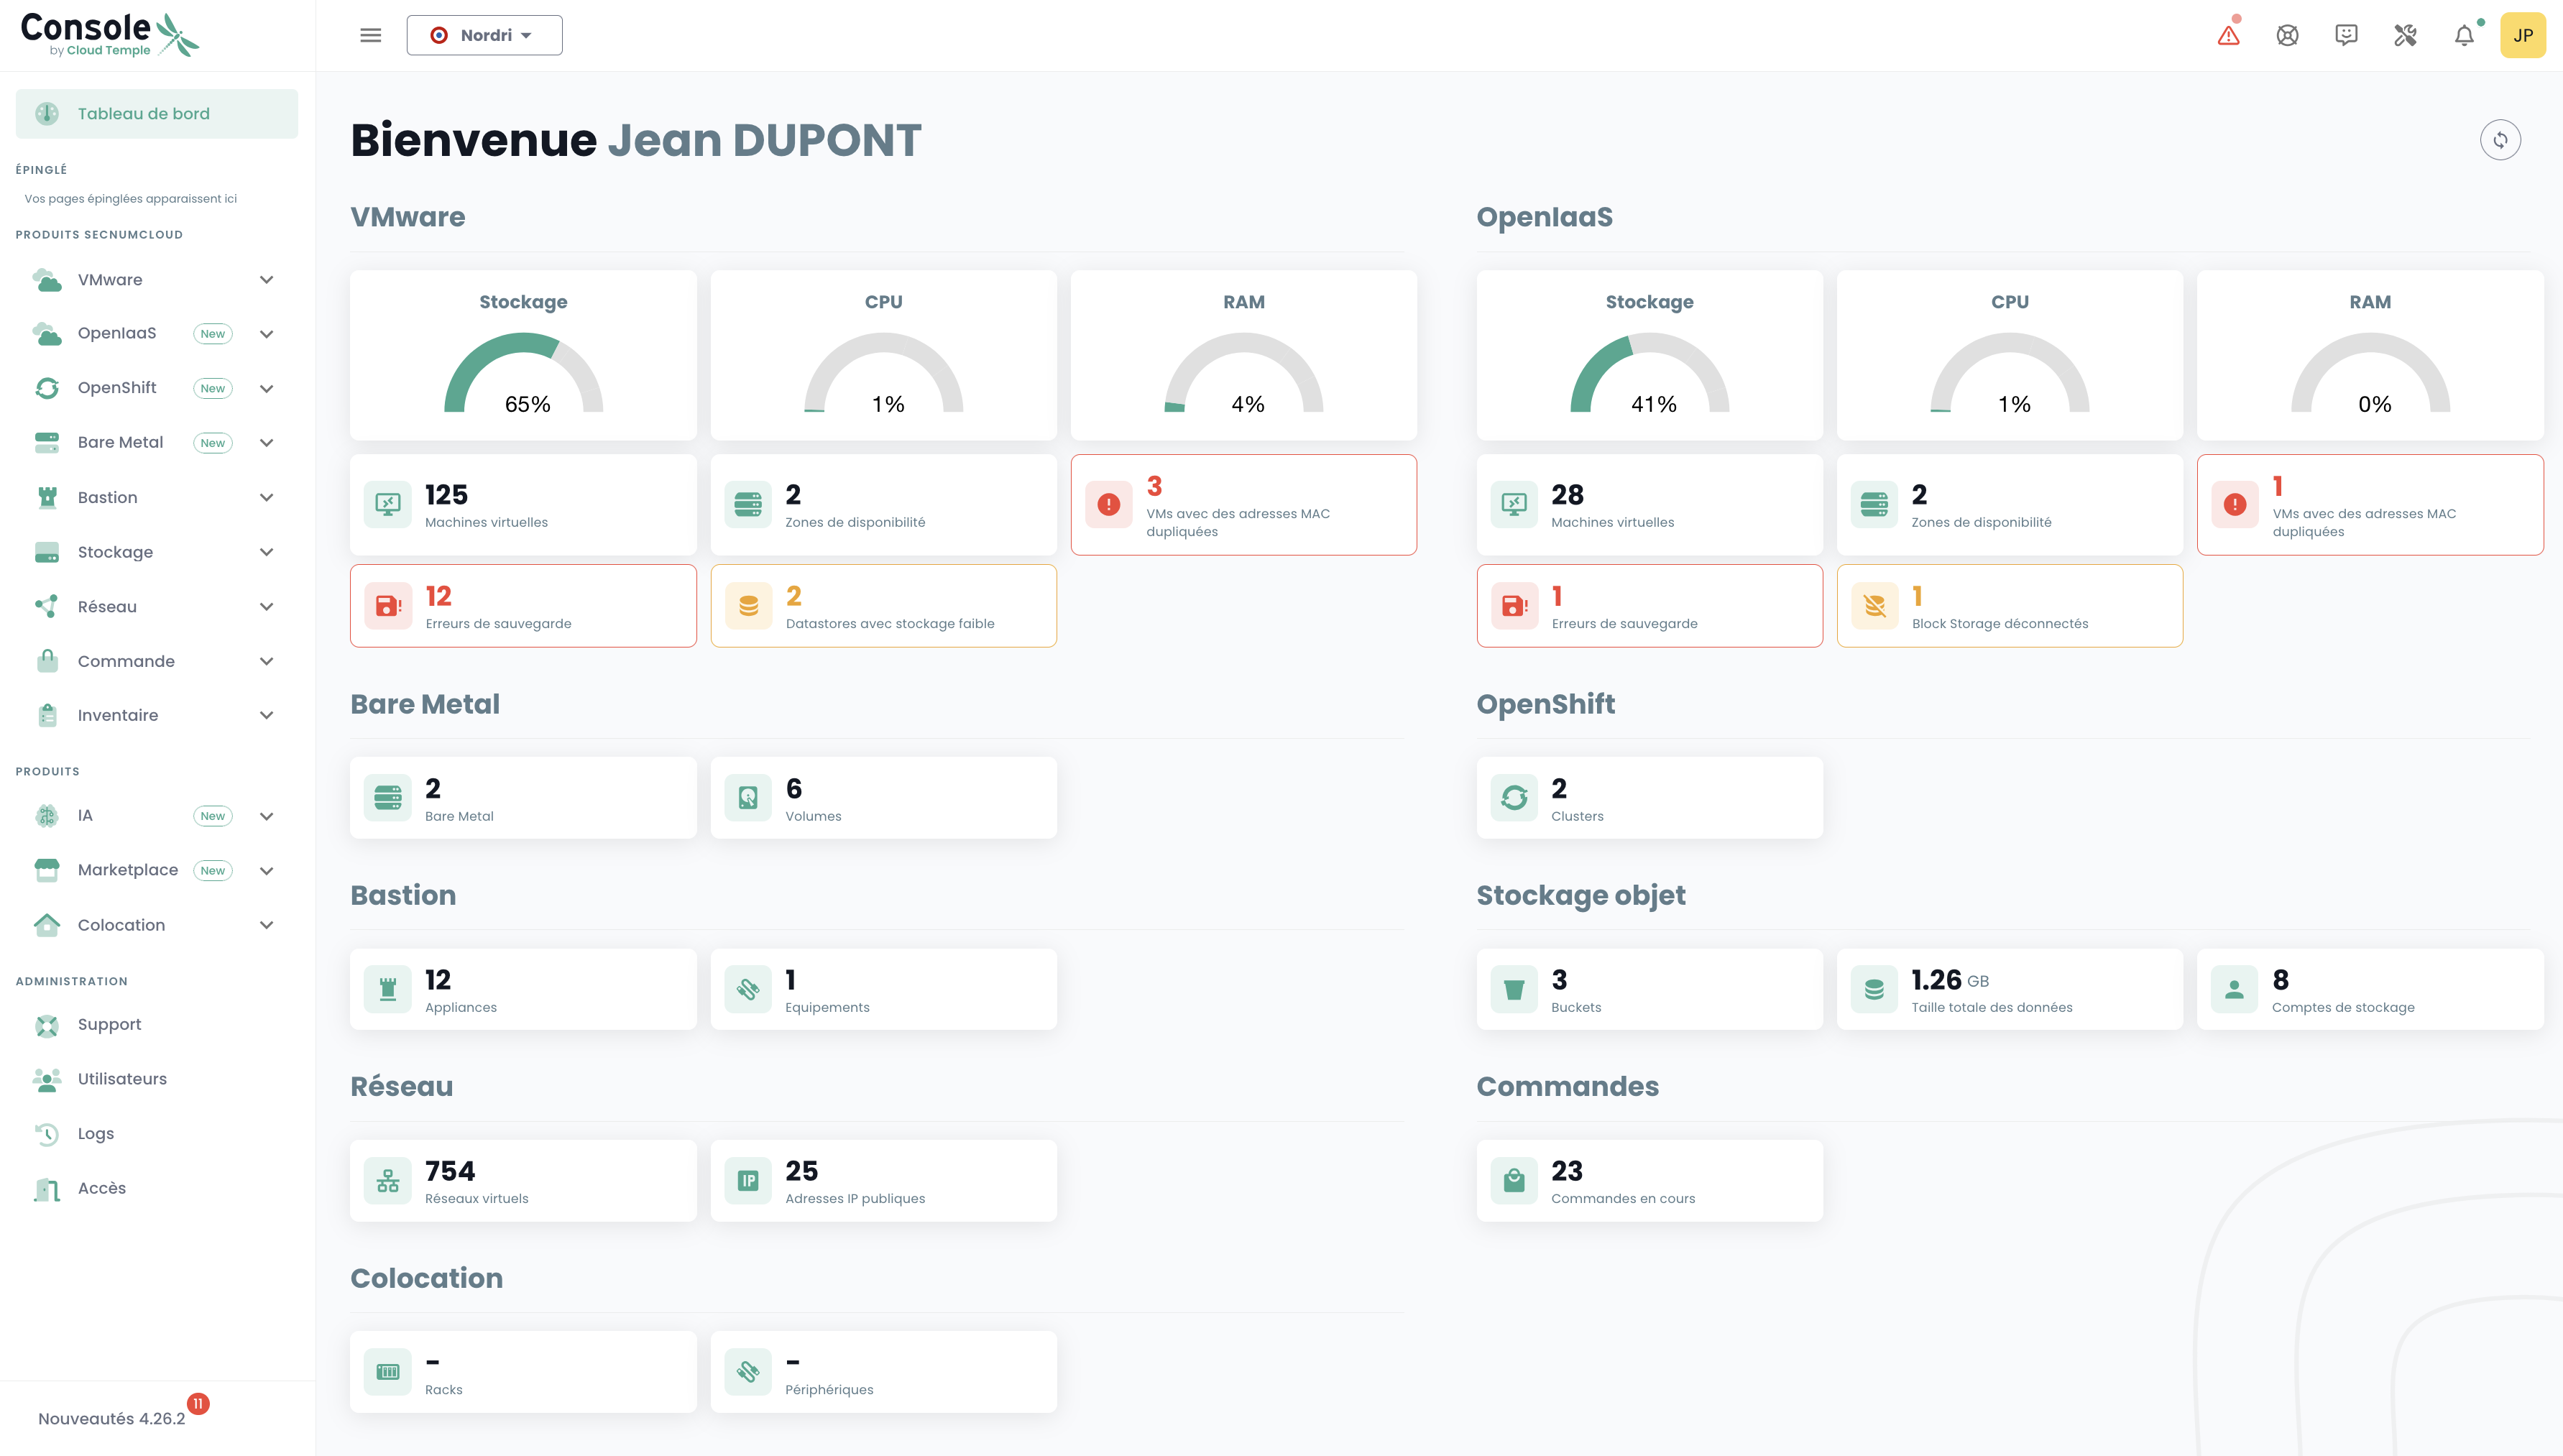
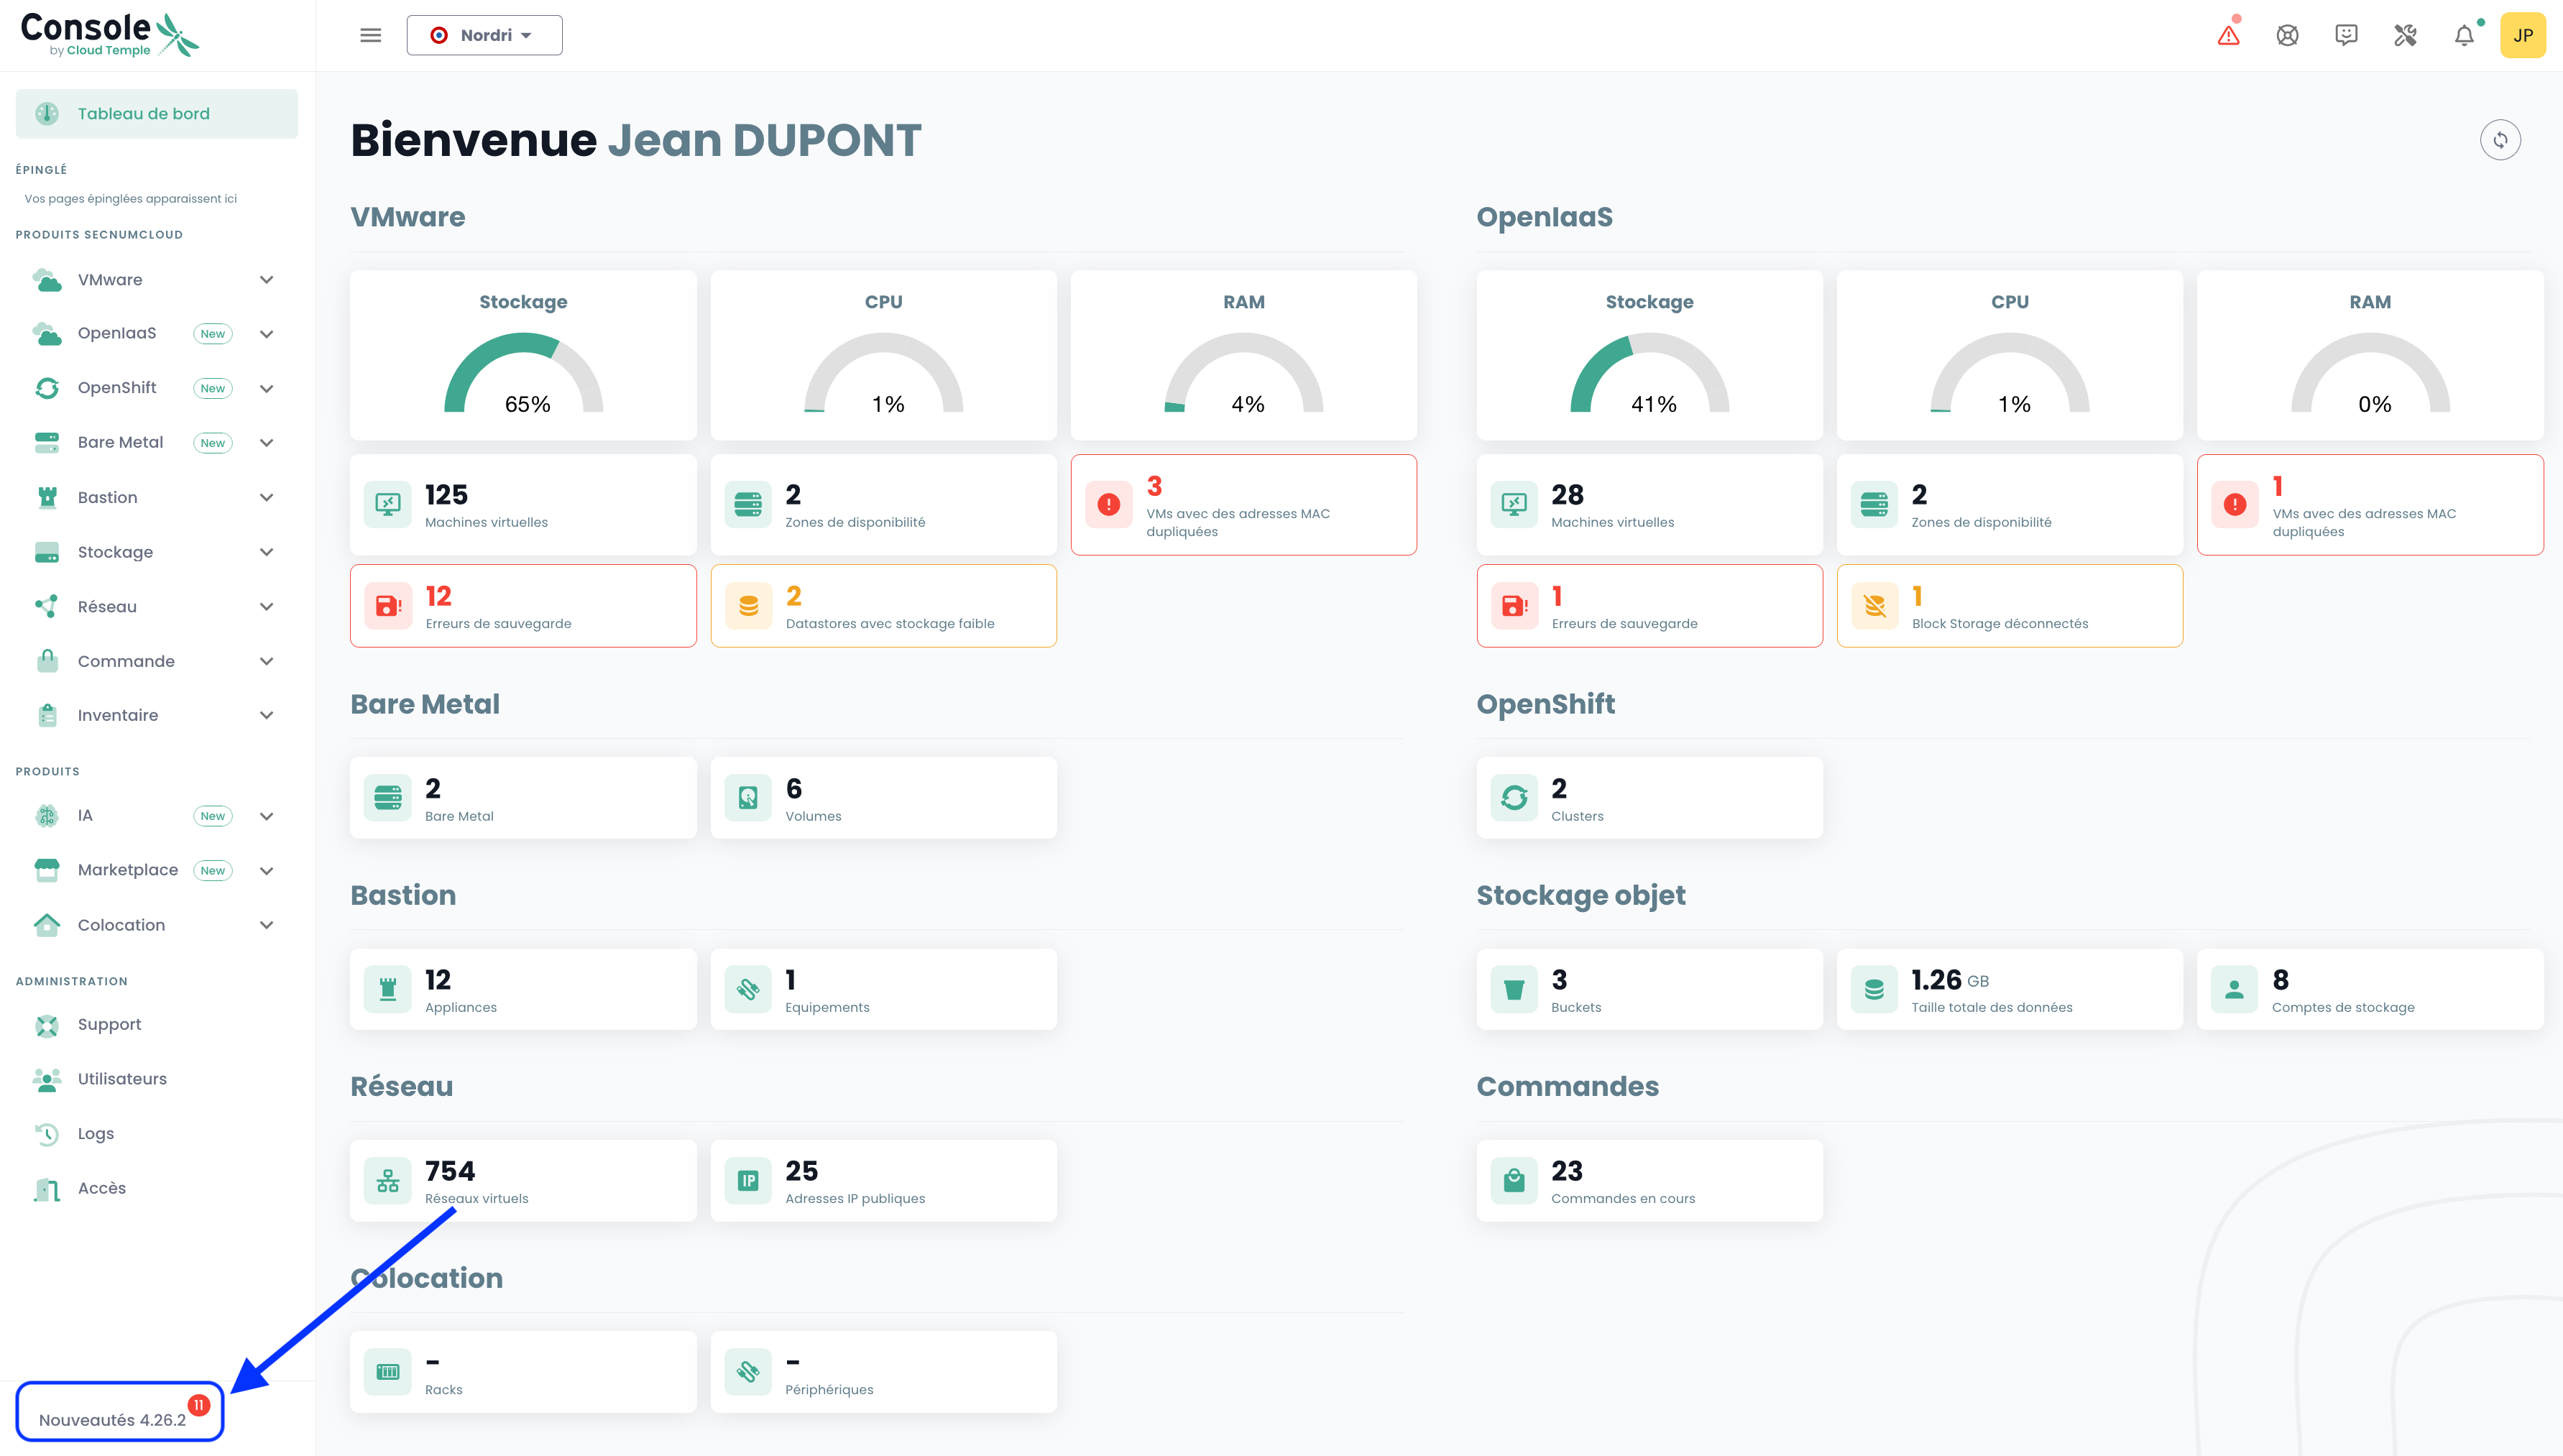
You will then be redirected to a page asking you to authenticate. Once logged in, you will arrive on this page.
You will find all metrics regarding the products subscribed to within your scope. In case of issue(s) with your VMware and/or OpenIaaS products, alerts will be visible; the color corresponds to their severity.
Language Management
The console is available in French, English. You can change the working language using the language icon located in the top right corner of the screen.
A user's language change must be performed in their 'Profile', located in the top right corner of the screen, in 'User Settings'.
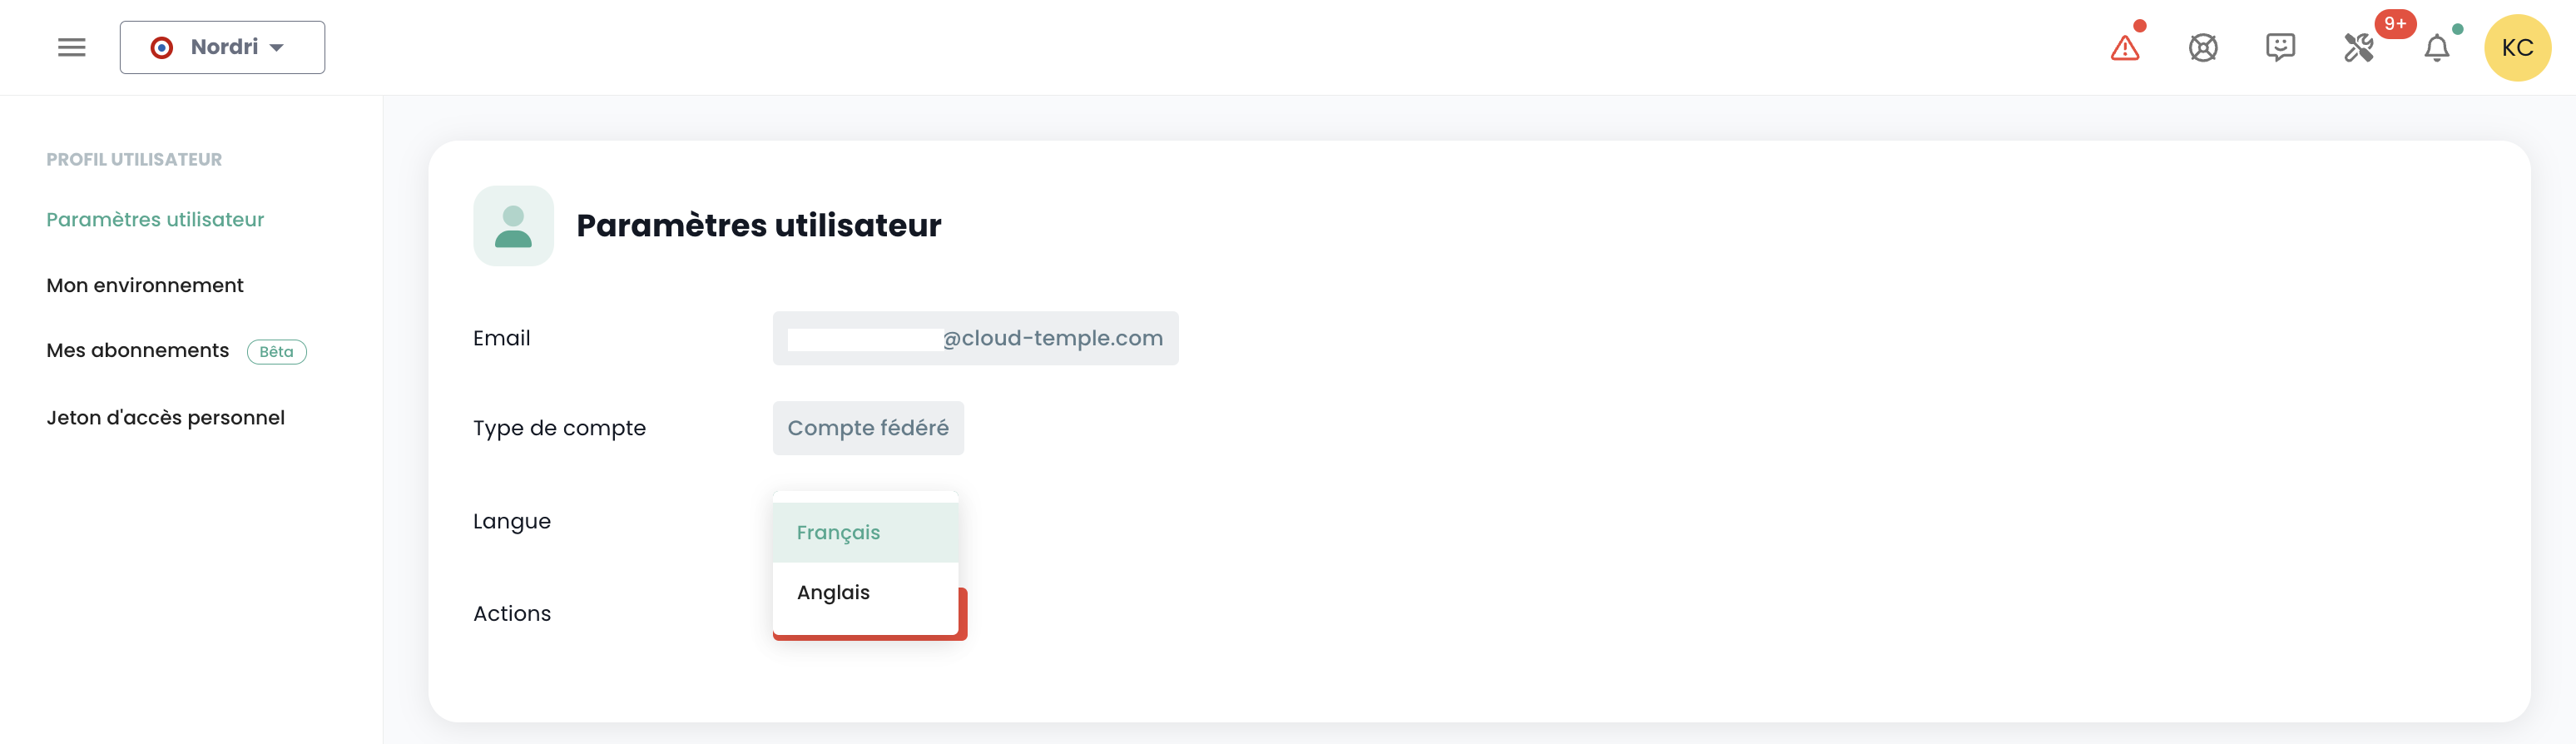
The configuration is applied per tenant Tenant.
Technical Support Access
At any time, you can contact the Cloud Temple support team via the 'lifebuoy' icon located in the top right corner of the screen.
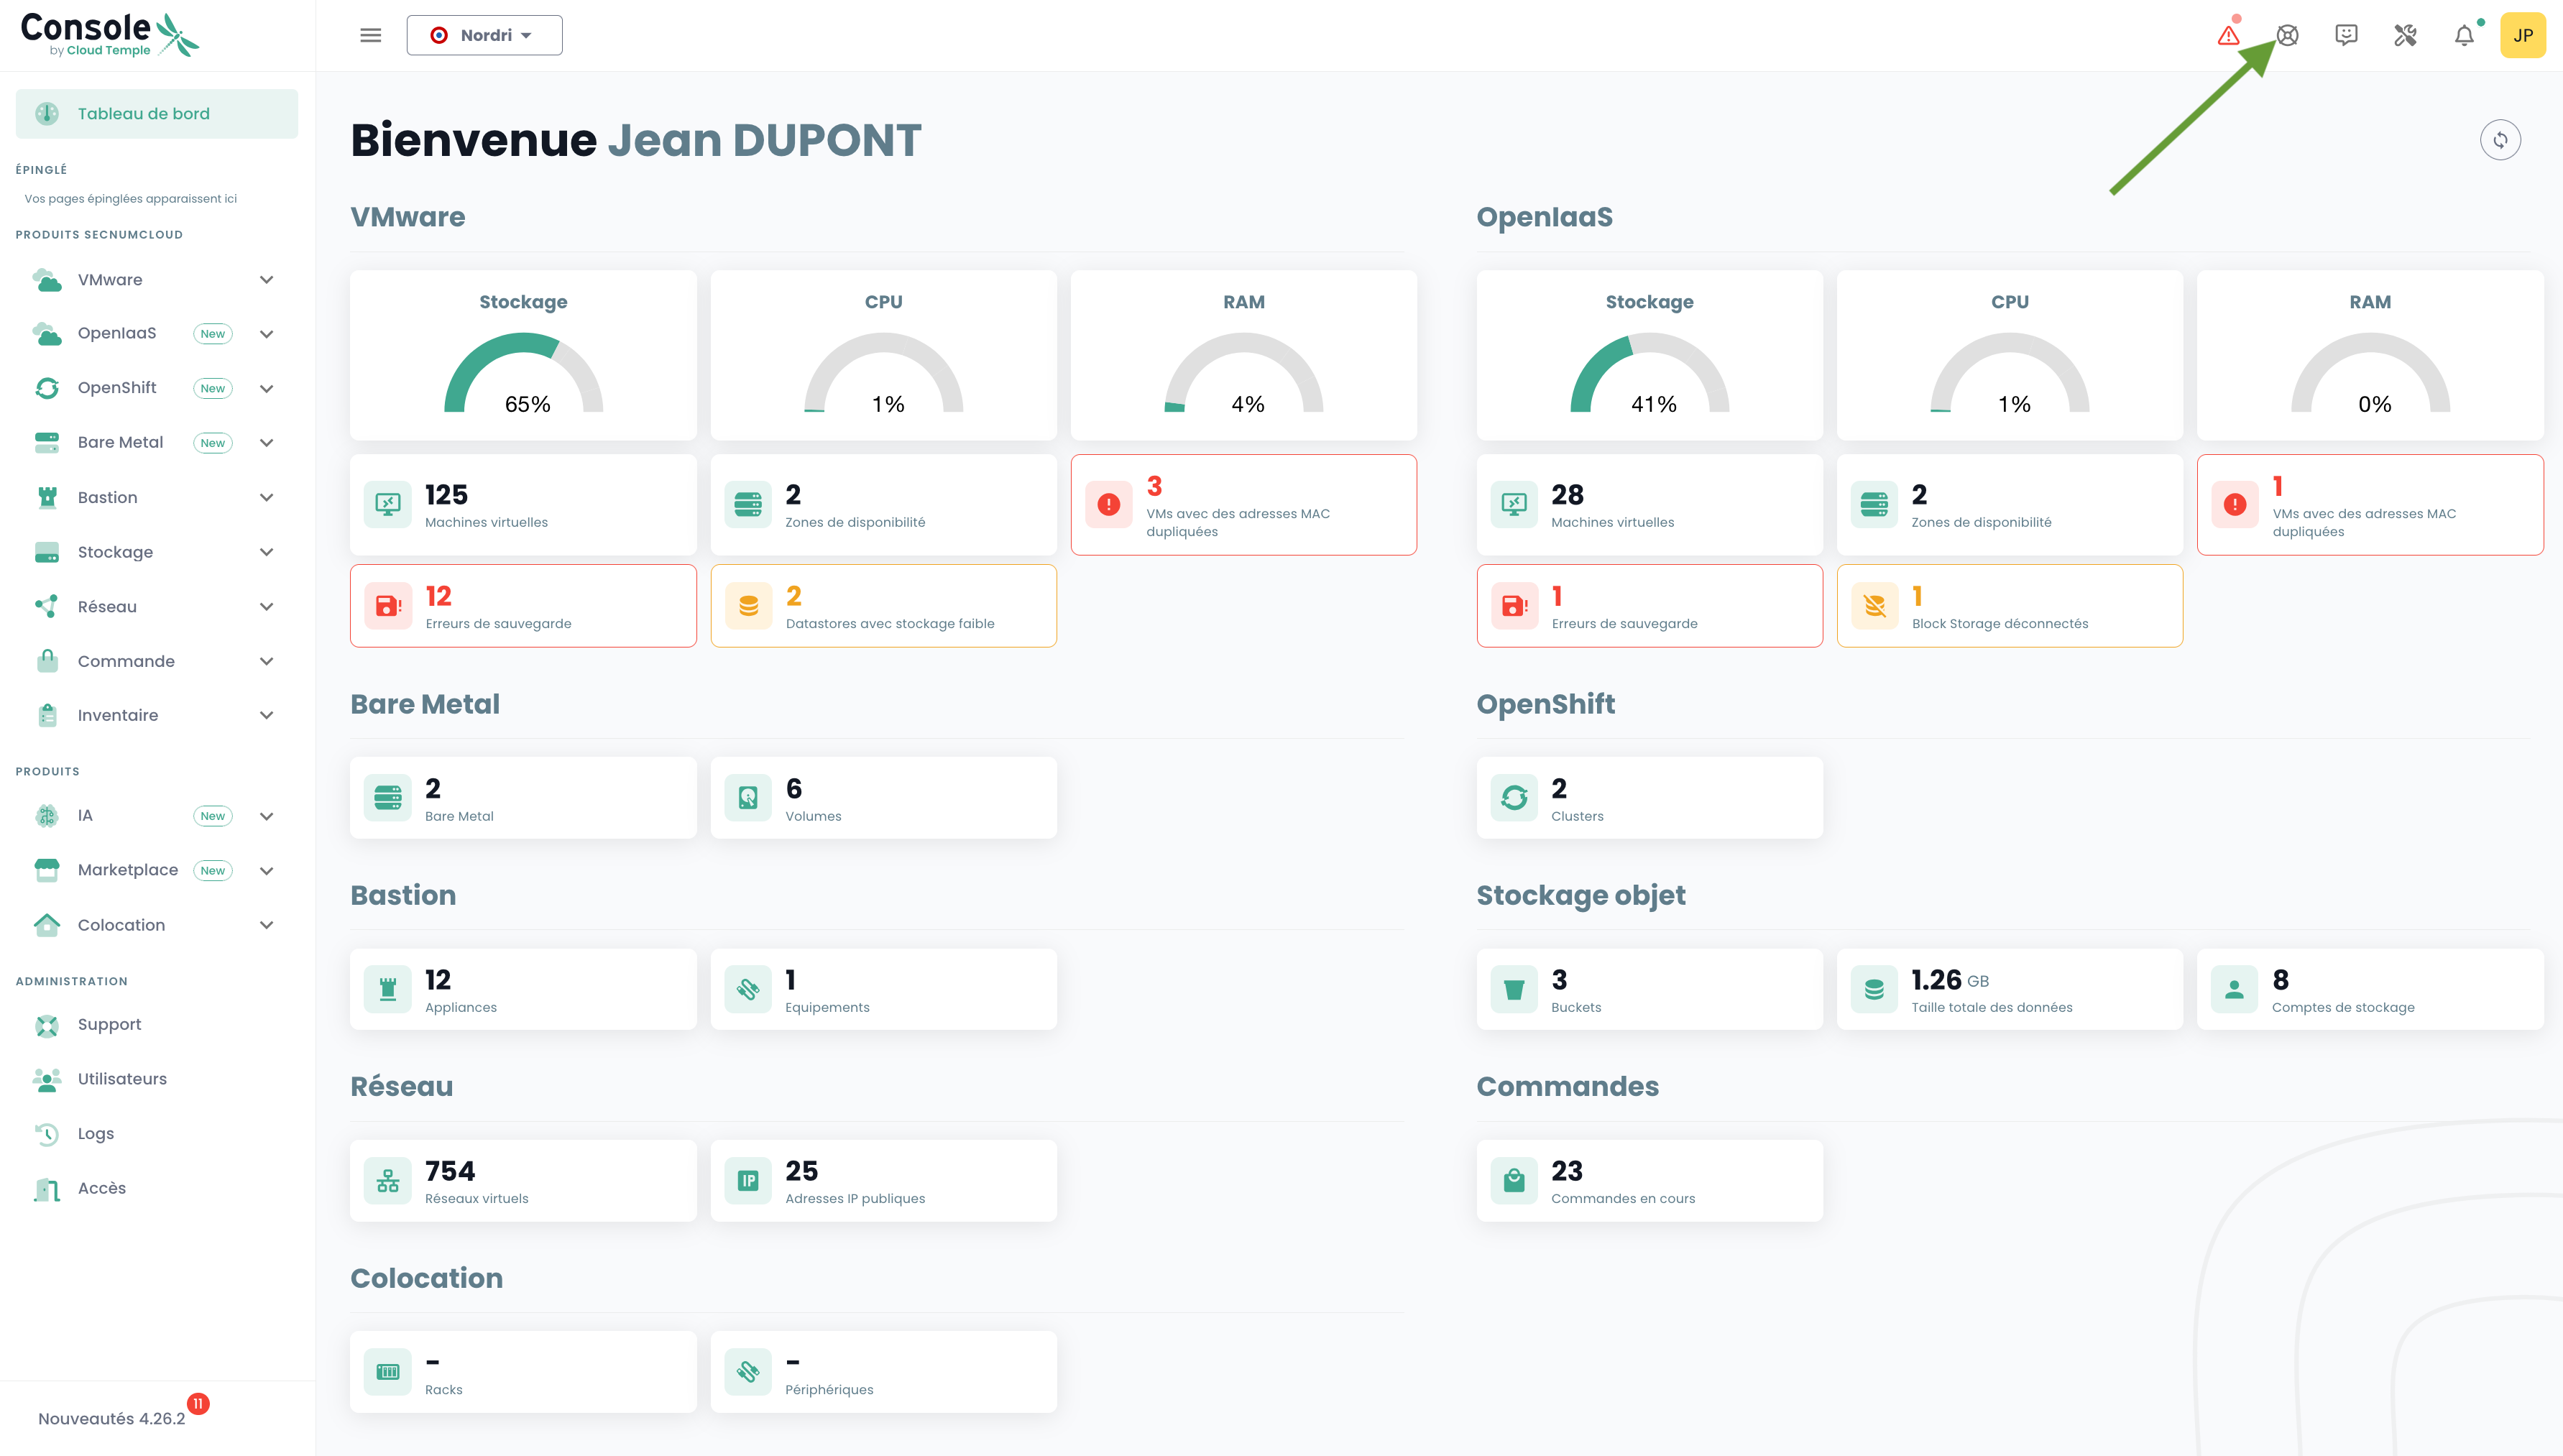
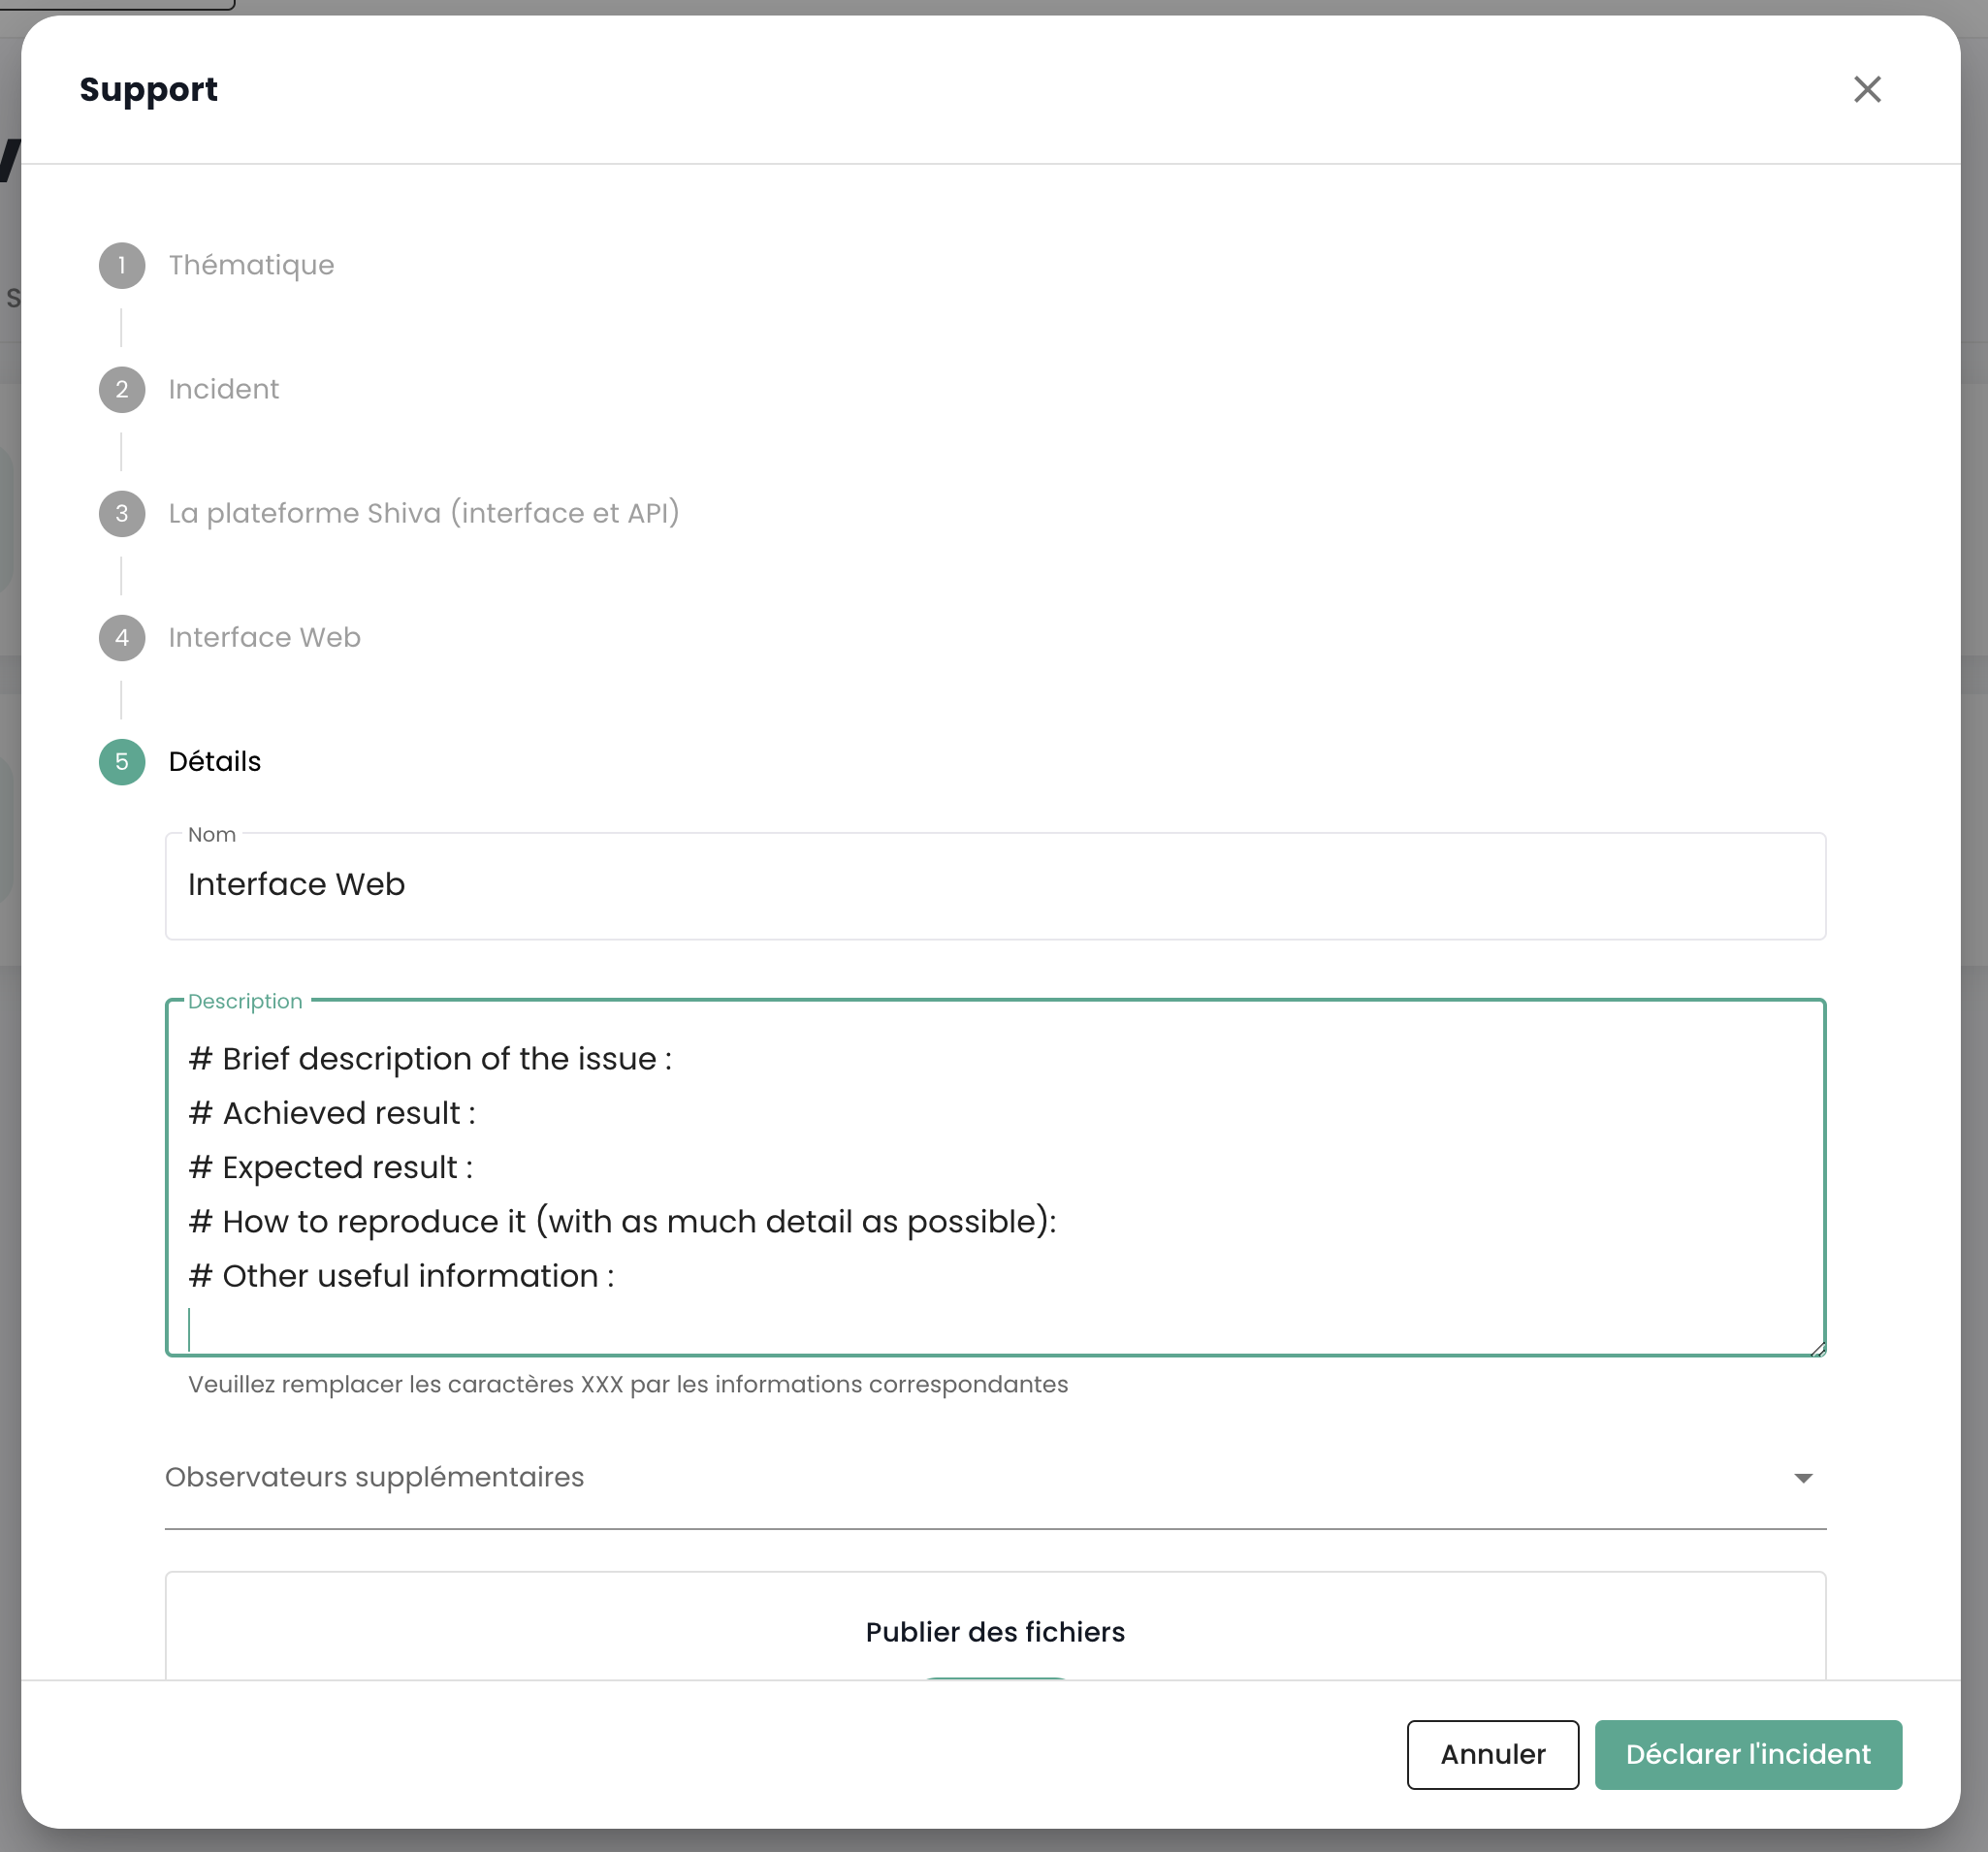
You will be guided throughout the support request process.
The first step is identifying the type of support request:
- Request advice on using a product (hors incident),
- Request assistance related to your customer account,
- Report an incident or request technical support.
- Request professional service assistance (mise à disposition d'un ingénieur Cloud Temple sur une problématique).
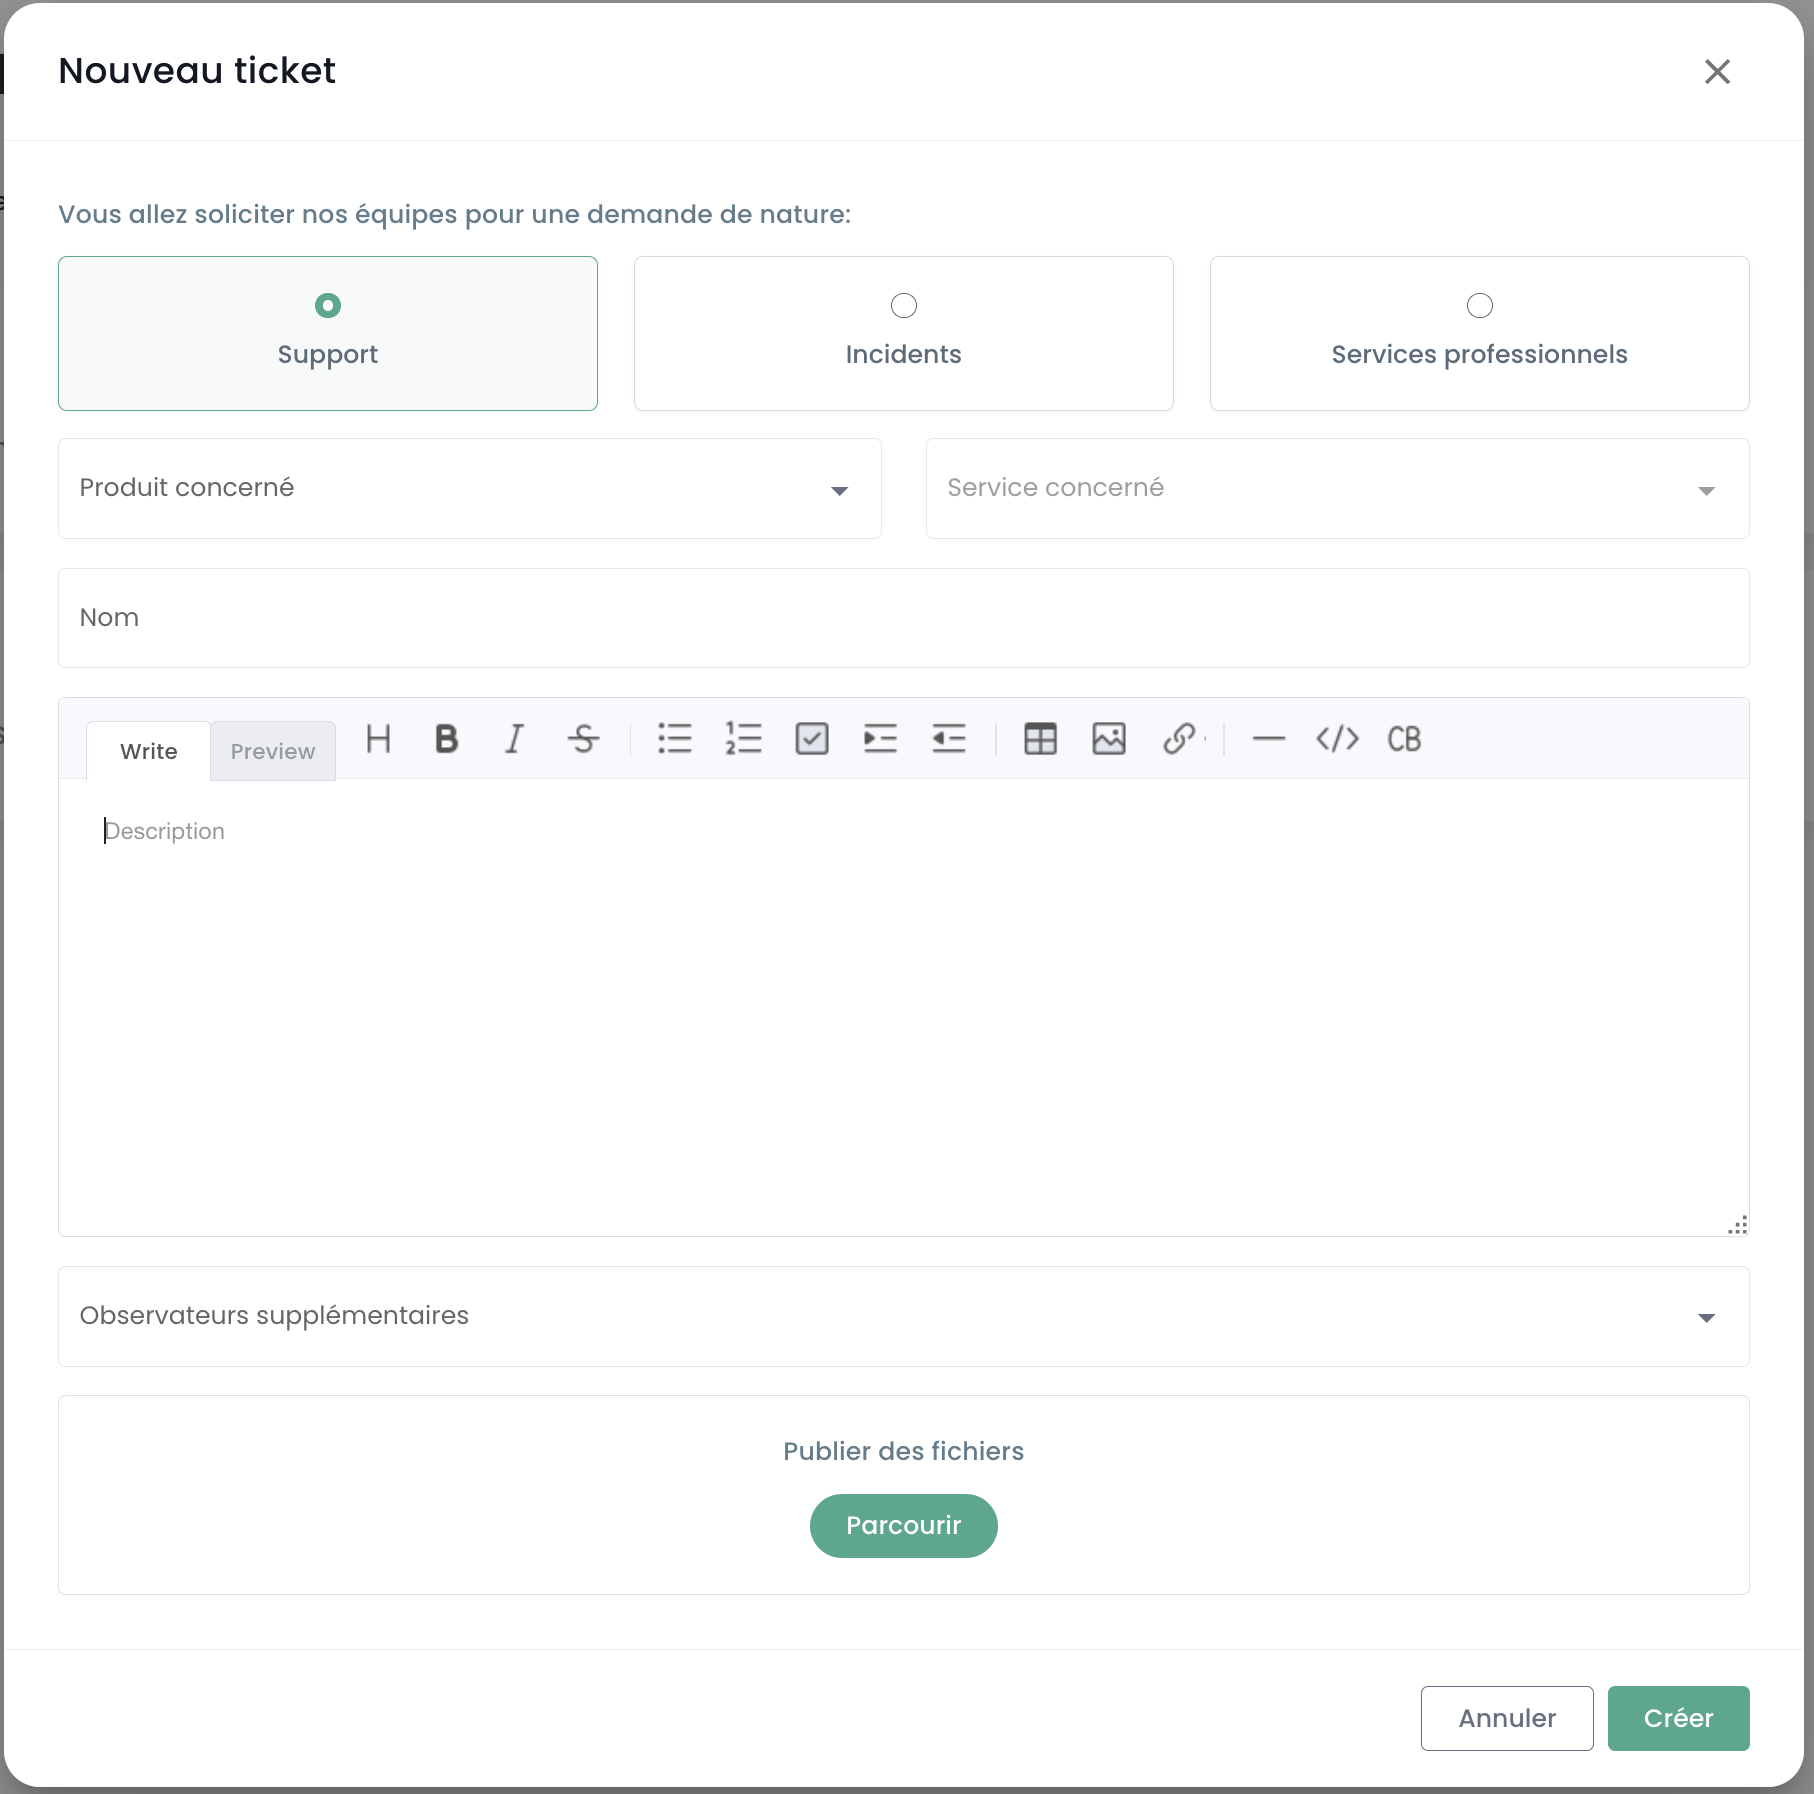
You can then provide additional details and attach files (image ou journaux par exemple).
The requester can also specify a criticality level (P1 à P5) in the ticket description, in the case of a security incident, such as:
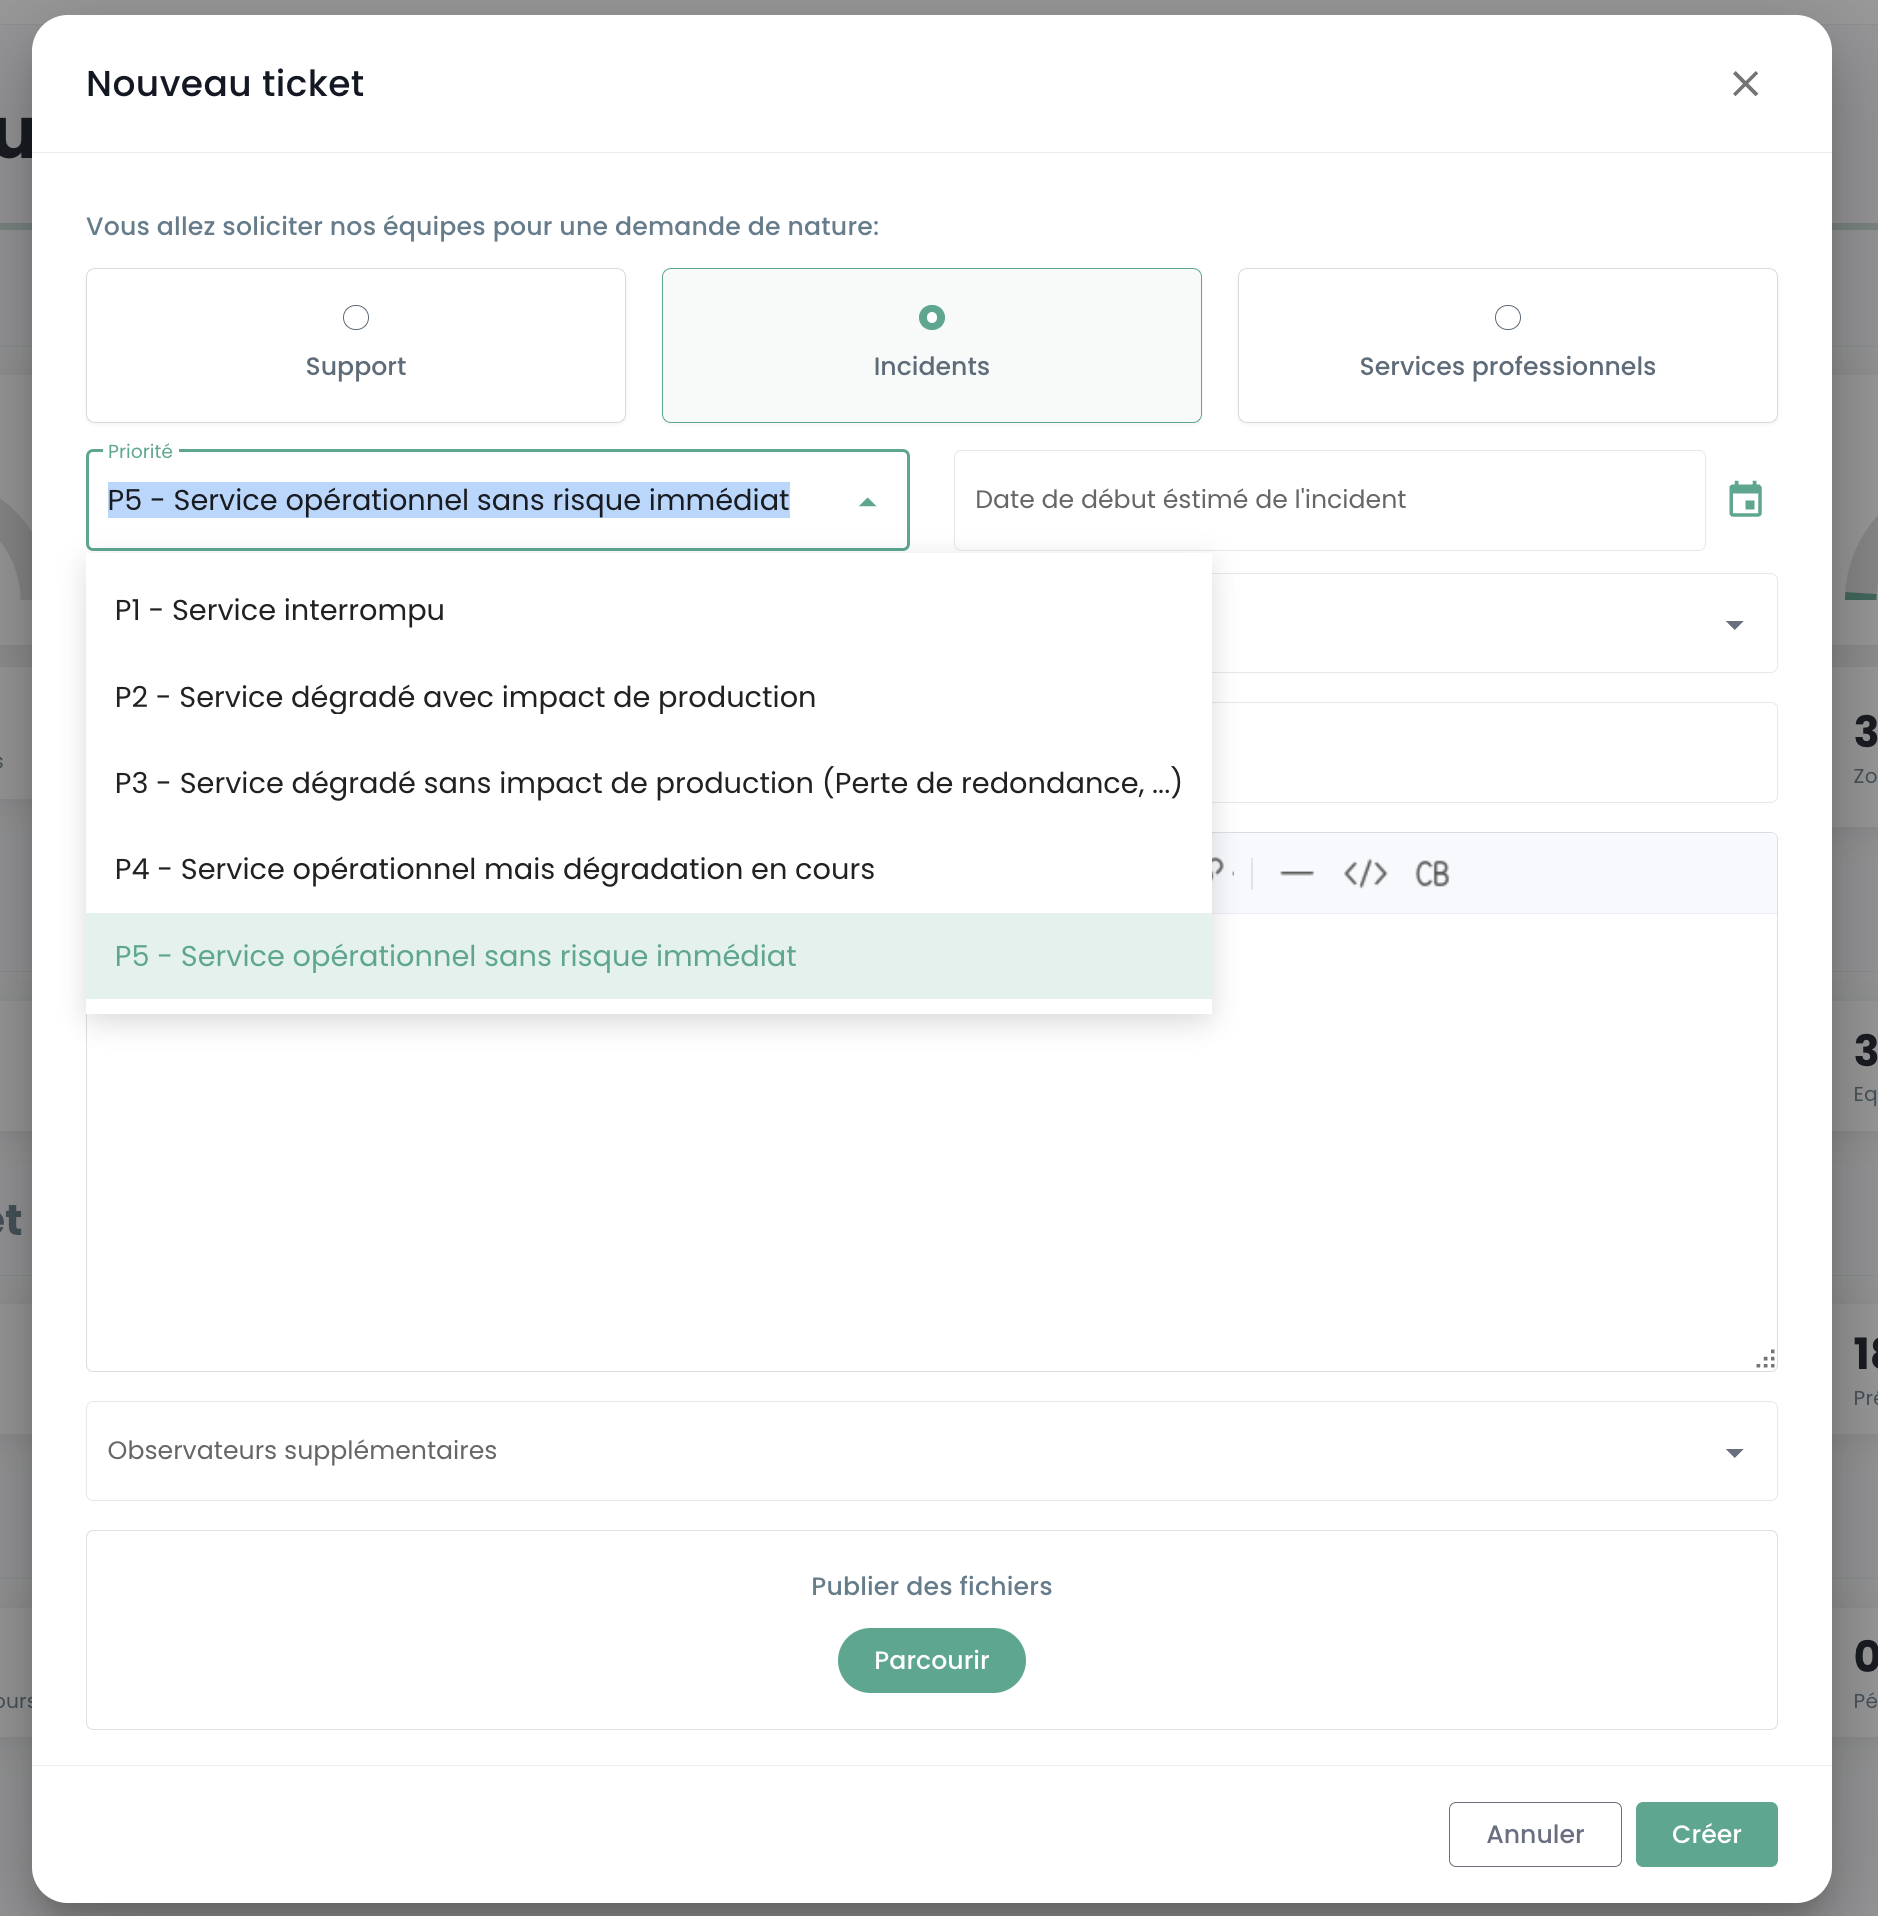
CRITICAL (P1):
- Suspected sensitive data breach
- Detection of unauthorized access to your data
- Compromise of your administrative credentials
- Total unavailability of your critical services
- Abnormal behavior on sensitive data
- Personal data breach
HIGH (P2)h:
- User access malfunction
- Anomaly in your data encryption
- Loss of access to certain critical features
- Data inconsistency
- Major slowdowns impacting business operations
MEDIUM (P3):
- Localized performance issue
- Incident on a non-critical function
- Configuration error with limited impact
- Occasional access difficulty
LOW (P4):
- Investigation request
- Anomaly with no direct impact
- Compliance question
- Need for technical clarification
OPERATIONAL SERVICE (P5):
- Operational service with no immediate risk
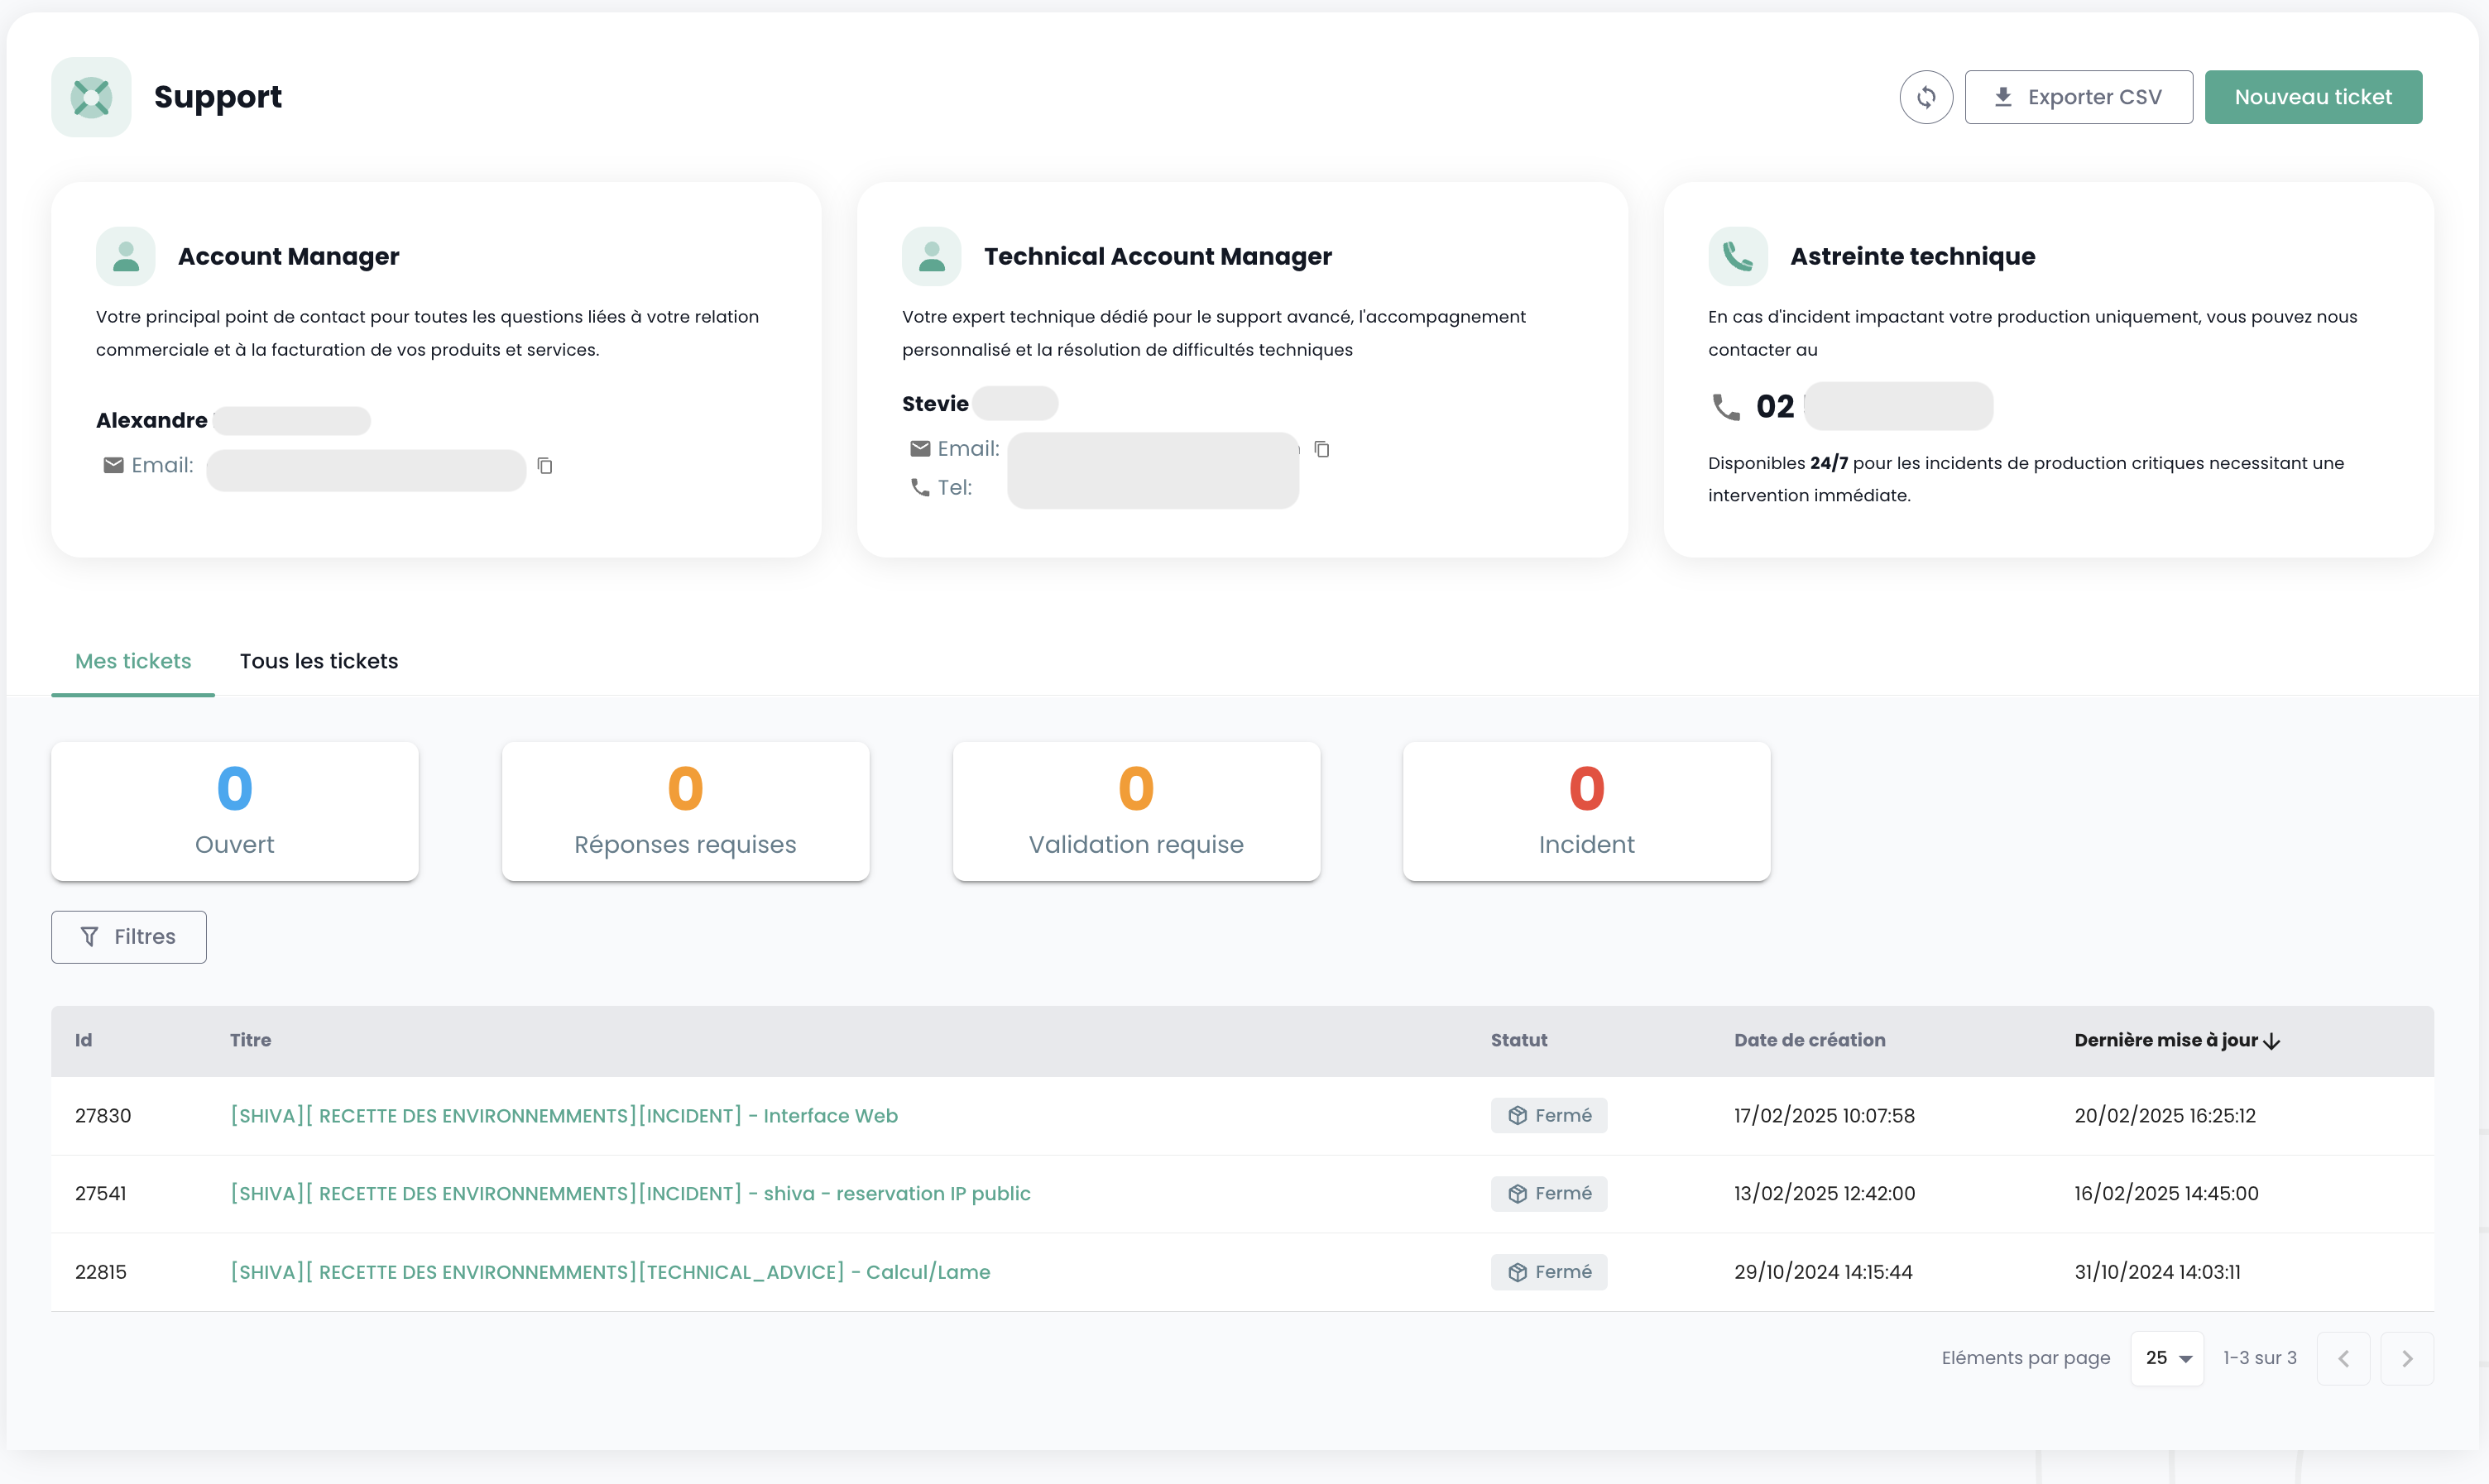
Once your request is submitted, you can retrieve your requests via the 'lifebuoy' icon located in the top right corner of the screen :
User Feature Access via the Web Interface
All features accessible to your user (en fonction de ses droits) are located on the left side of the screen, in the green banner. Features are grouped by module. This primarily includes:
- The inventory of your resources,
- The operation tracking,
- The management of IaaS resources (Calcul, stockage, réseau, ...)
- The management of OpenIaaS resources (Calcul, stockage, réseau, ...)
- Access to ancillary services (Bastion, monitoring, ...)
- The administration of your organization (Gestion des tenants, des droits, ...)
Enabling a module for a user depends on the user's permissions. For example, the 'Order' module will not be available if the user does not have the 'ORDER' permission.
Below is a presentation of the available modules. New modules are regularly added to enrich the console:
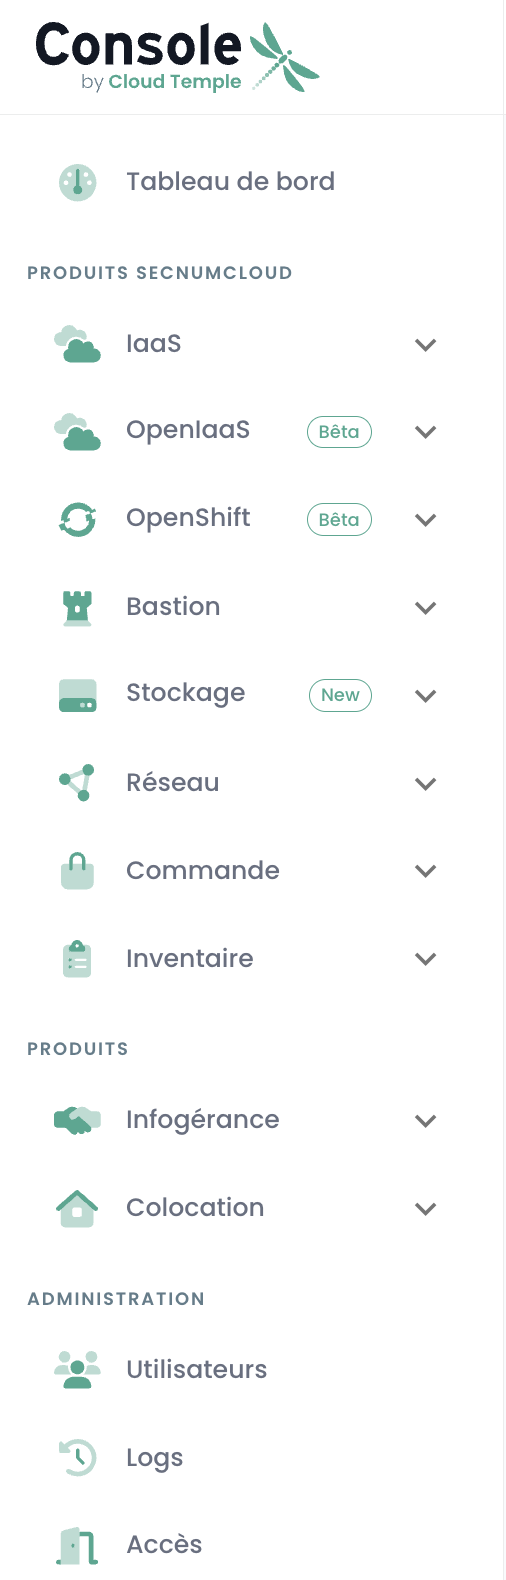
- Dashboard : provides a quick overview of the total compute and storage resources, backup statistics, and a summary of support tickets,
- Inventory : provides a view of all your 'virtual machines' resources. If tags are used, it allows a view by tag (par exemple, vue métier, vue applicatif, ...),
- Managed Services : provides access to tracking your support requests and service metrics,
- IaaS : allows management of VMware IaaS infrastructure (Machines virtuelles, clusters, hyperviseurs, réplications, sauvegarde, ...),
- OpenIaaS : allows management of Xen Orchestra resources (Machines virtuelles, sauvegarde, ...),
- OpenShift : allows management of your RedHat OpenShift PaaS architecture and management of your containers across the platform's 3 availability zones.
- Bastion : Allows deploying and managing SSH/RDP bastion appliances in your networks,
- Network : allows management of Layer 2 and Layer 3 networks, public IPs, and your telecom circuits,
- Colocation : Provides a view of equipment located in shared or dedicated colocation zones,
- Order : Allows ordering resources and tracking deployments,
- Administration : Groups user and tenant administration functions as well as access to global logging.
The 'NEW' pictograms indicate that the product in question has been provisioned but is not yet qualified under the SecNumCloud offer, and 'BETA' indicates that the product in question has been provisioned and has just been qualified under the SecNumCloud offer.
Logging - Activity Tracking
The activities page is designed to provide complete visibility into all read and write operations performed within the console, thereby ensuring enhanced traceability and security. It highlights the two main tabs: Recent and Archived.
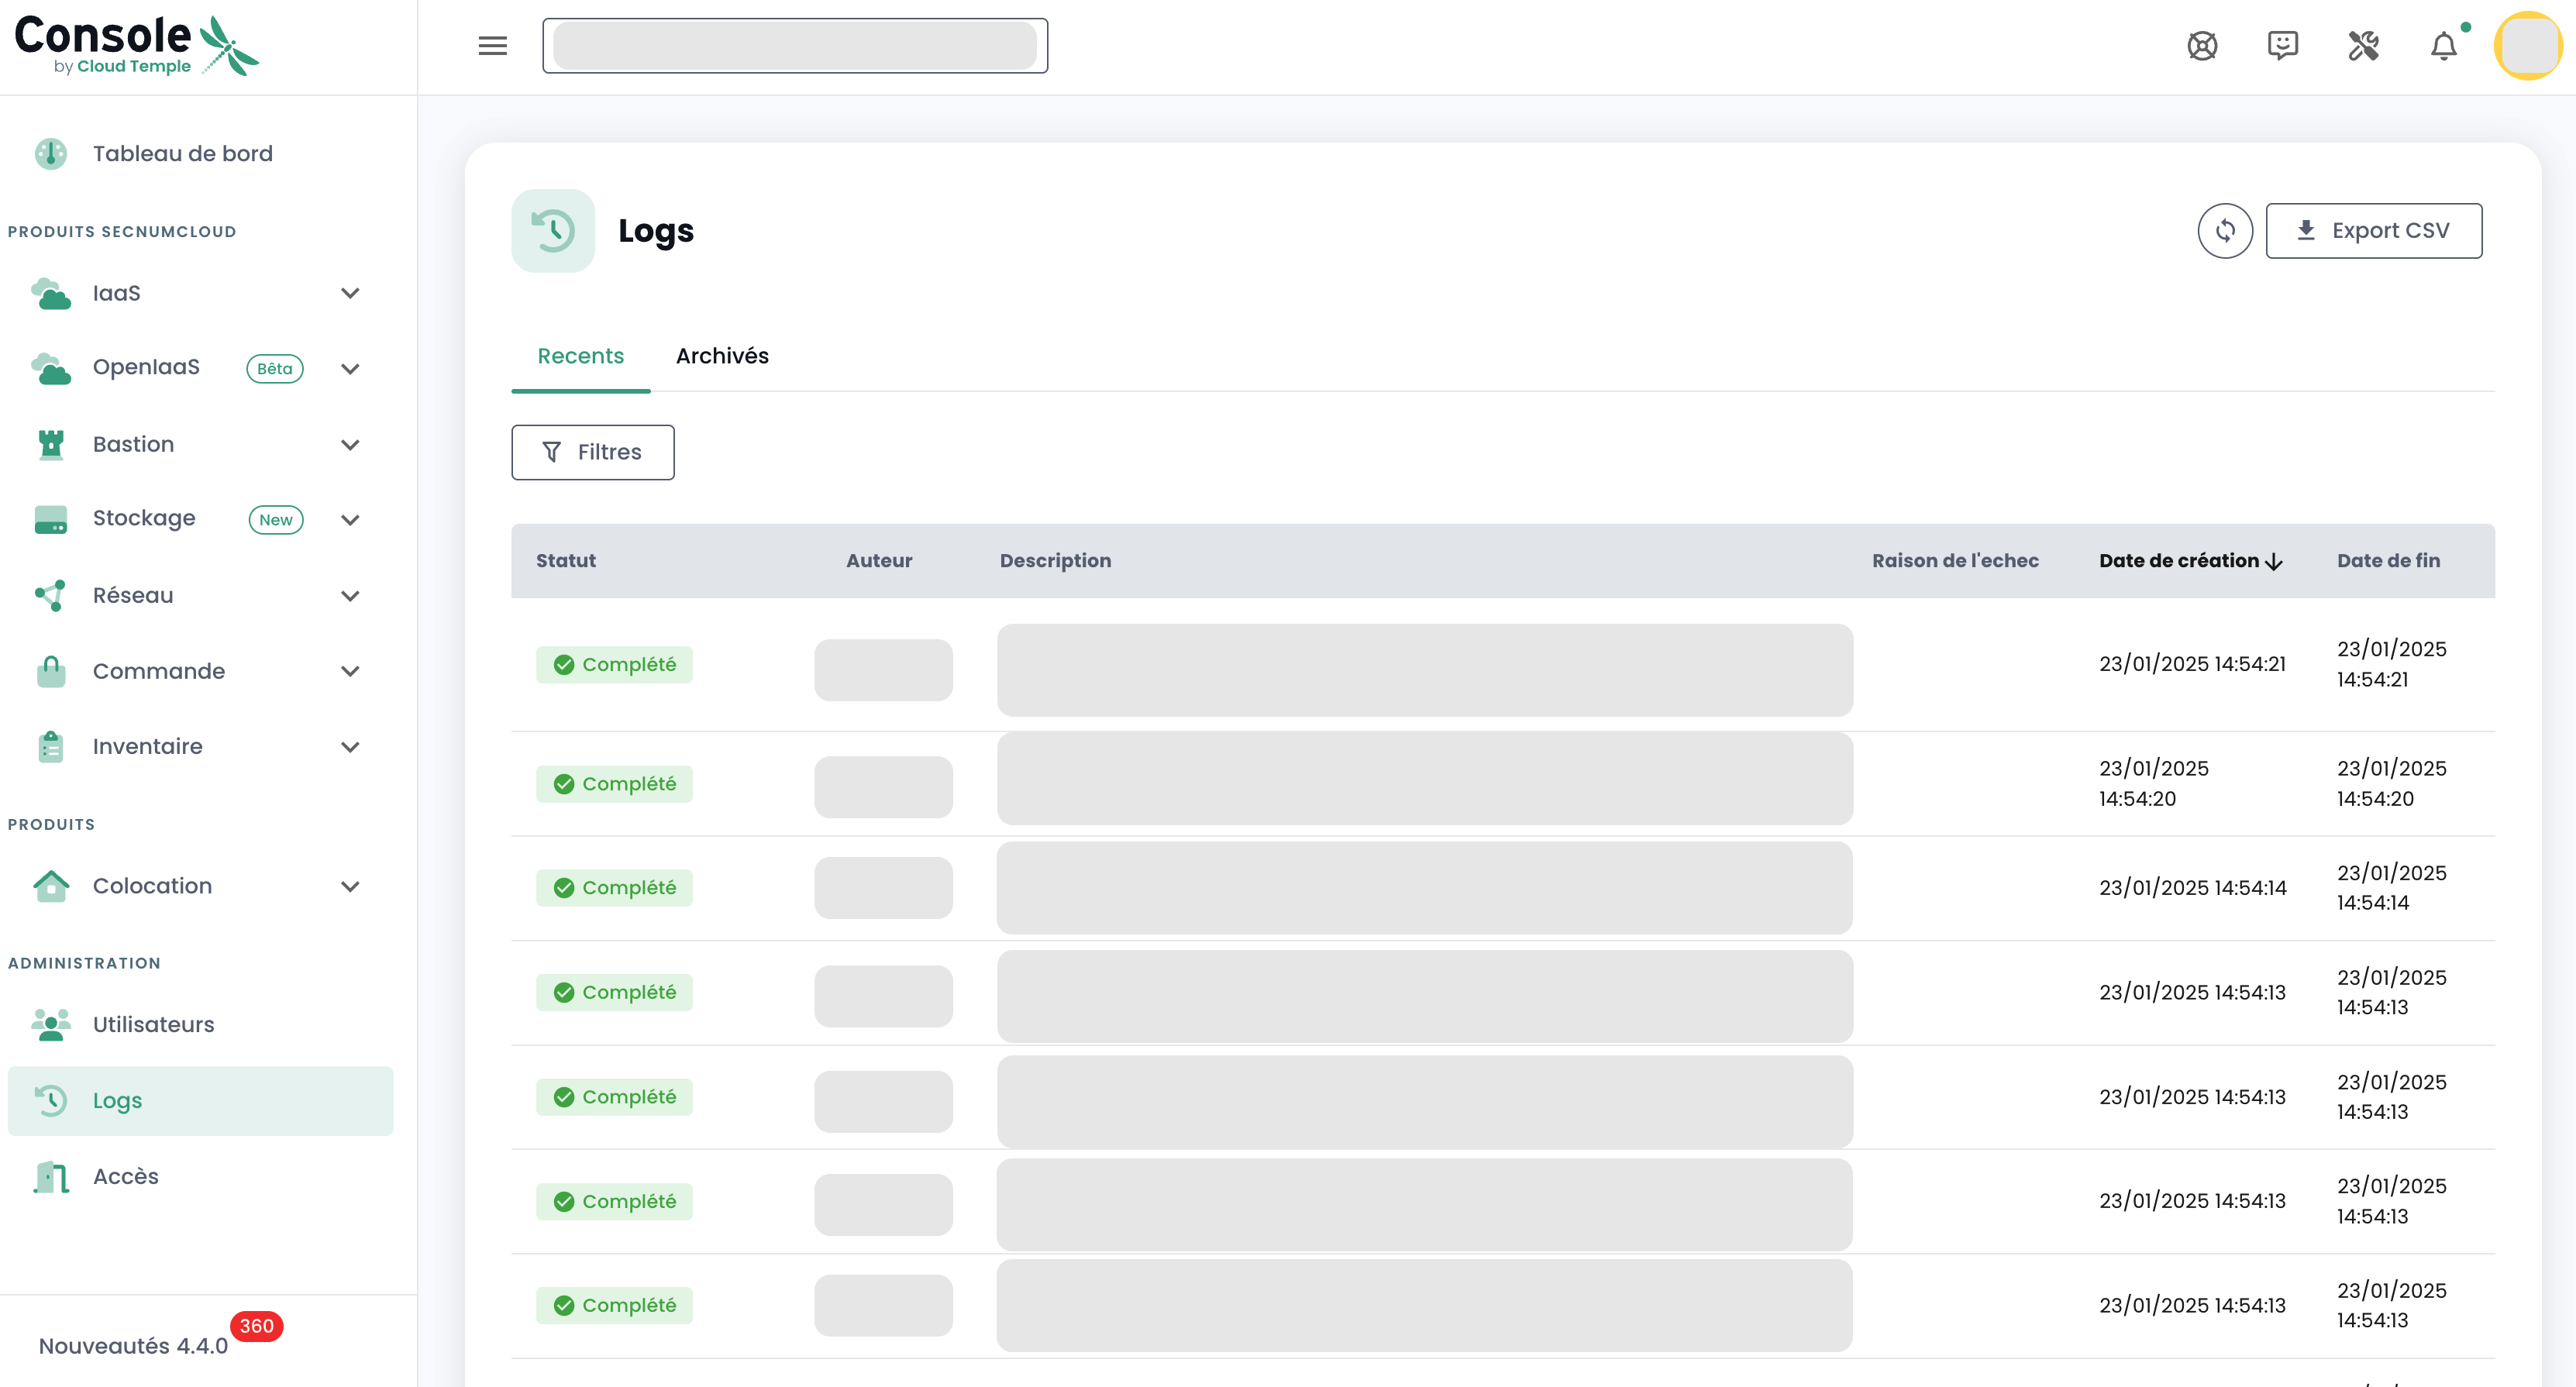
Page Structure
Tabs
-
Recent
-
Recent operations
-
Real-time monitoring
-
Archived
-
Operations over a longer period
-
Archived operations for traceability and compliance
Displayed Information
-
Date and Time
-
Operation Type
- Status
-
User
-
Operation Description
Feature
- Search/Filtering for specific operations
Usage
- Access: permission
activity_read - Navigation:
- Select the "Recent" tab for real-time operations.
- Choose "Archived" to view the history.
- Use the search and filtering features to locate specific operations.
Compliance Note
In accordance with the SecNumCloud qualification, event storage for the Cloud Temple console is retained for a minimum of 6 months, thereby ensuring compliance with security and traceability requirements.
Viewing the latest updates
Click on the 'What's New' icon at the bottom left of the green banner. You will see the details of the changes for each version of the Cloud Temple console.
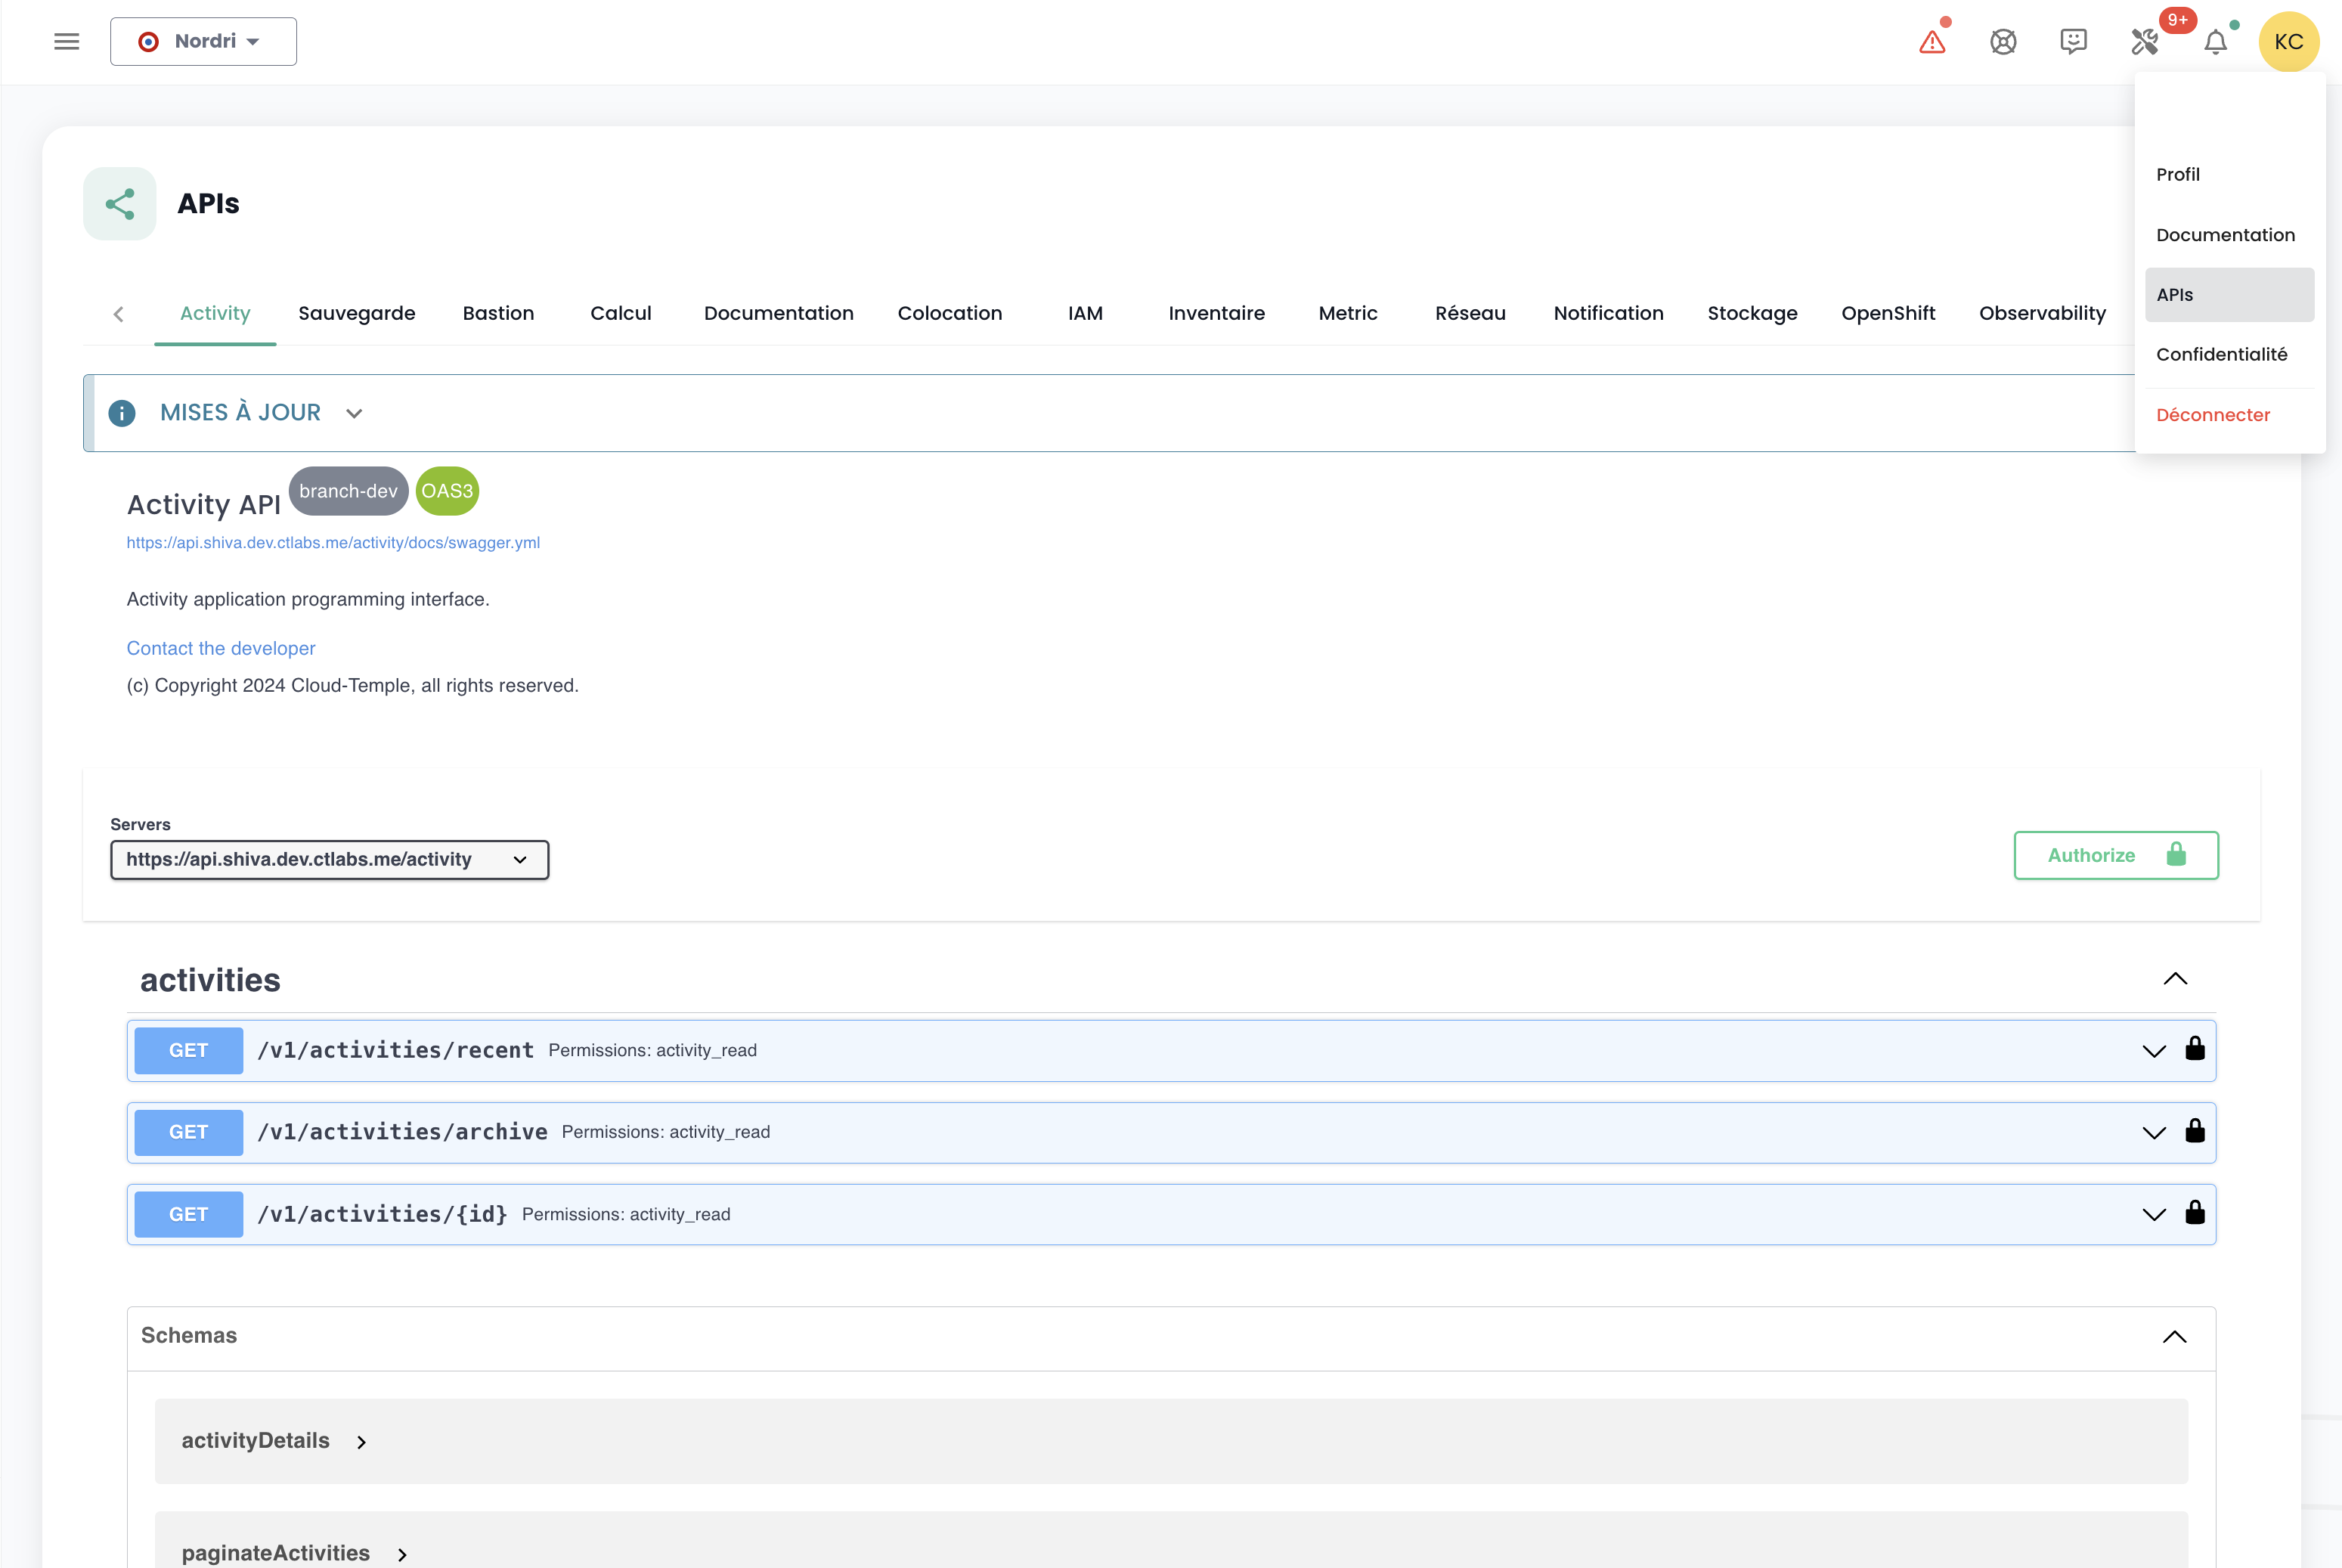
Access to user features via the API
Access to all Console features is available via the Console API. You can view details on the verbs and configurations via 'Profile' and 'APIs' :
Terraform Provider
Cloud Temple provides you with a Terraform provider to manage your Cloud platform *"as code".