Cost Manager
Overview
The Cost Manager is the module of the Cloud Temple Console dedicated to visibility into your consumption. It allows you to track in real time the usage of your cloud resources within a tenant and gain a clear view of your expenses.
This module addresses a fundamental need: understand what you consume, when you consume it, and at what cost, without having to navigate through complex tables or detailed invoices.
The Cost Manager displays the actual consumption of your resources on the selected tenant. The data is updated regularly to reflect your current usage.
Main Dashboard
The Cost Manager home page provides a visual summary of your consumption. Upon opening, you have an overview that allows you to quickly identify consumption trends and the most significant cost categories.
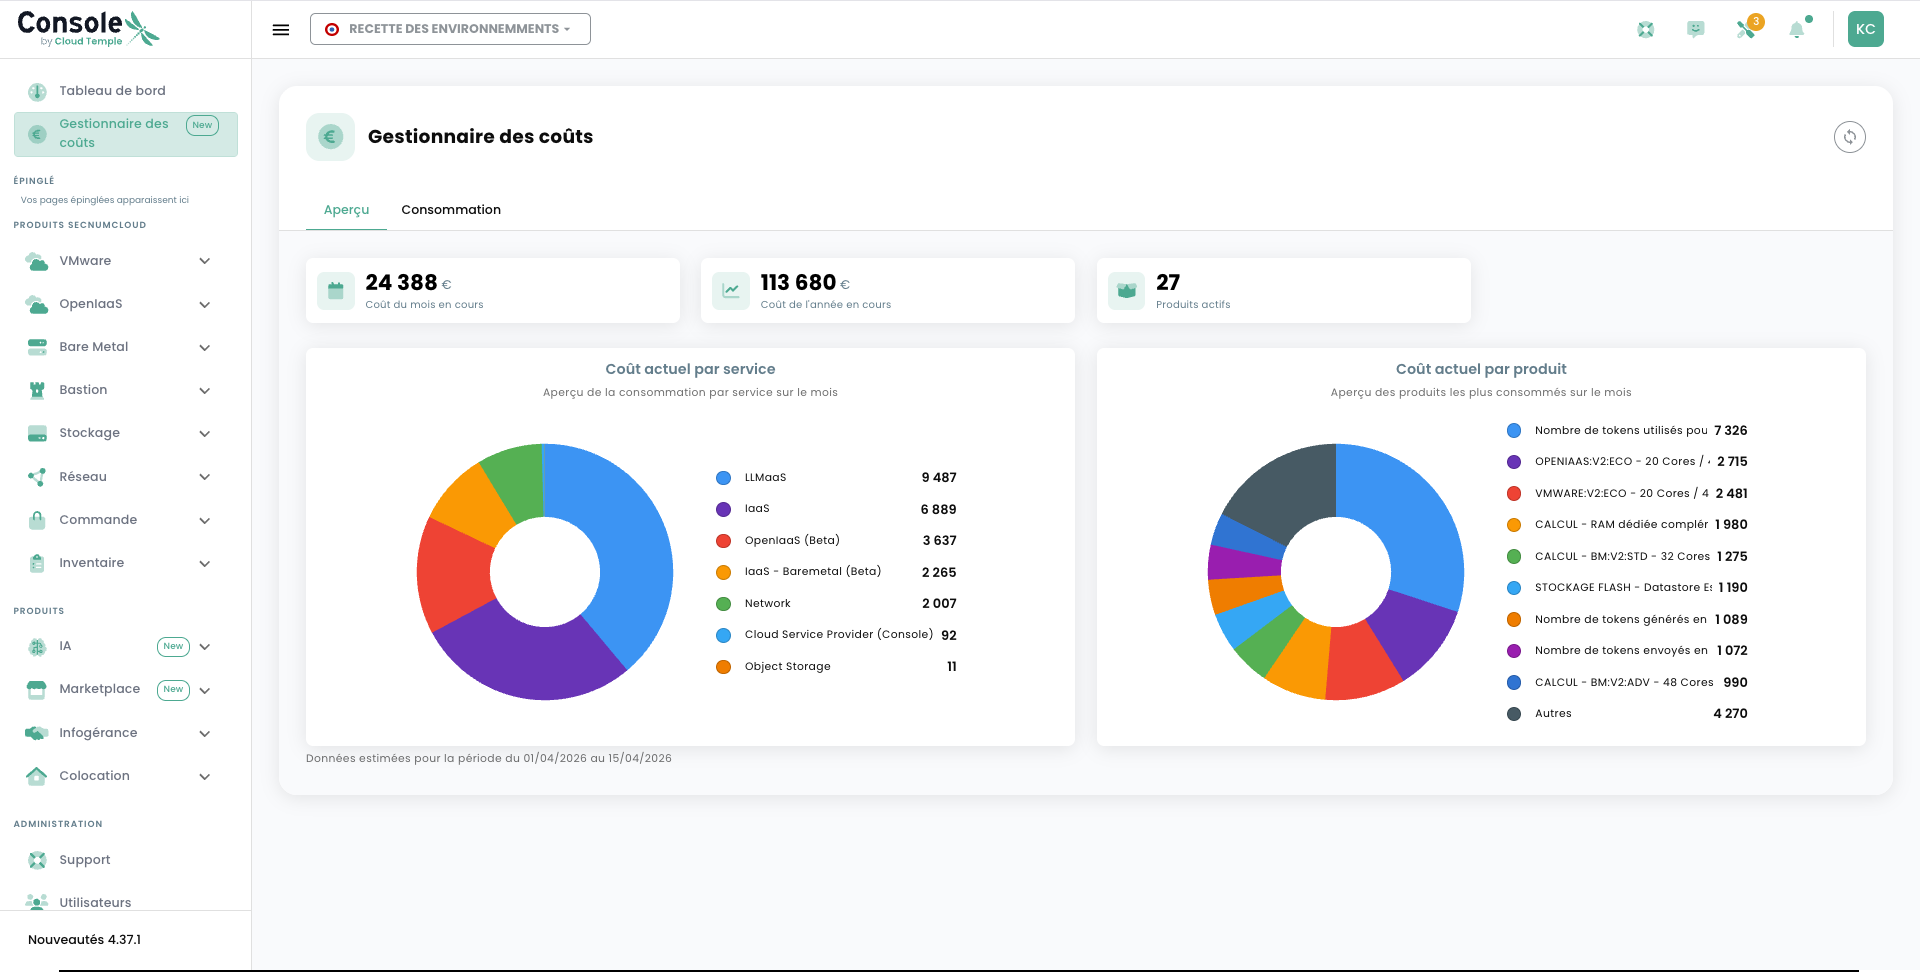
The dashboard is organized around several complementary sections, accessible via the tabs available at the top of the page.
Total Consumption
The Total Consumption tab provides an aggregated view of all your consumption over the selected period. This chart allows you to observe the evolution of your spending over time and identify any potential spikes or trends.
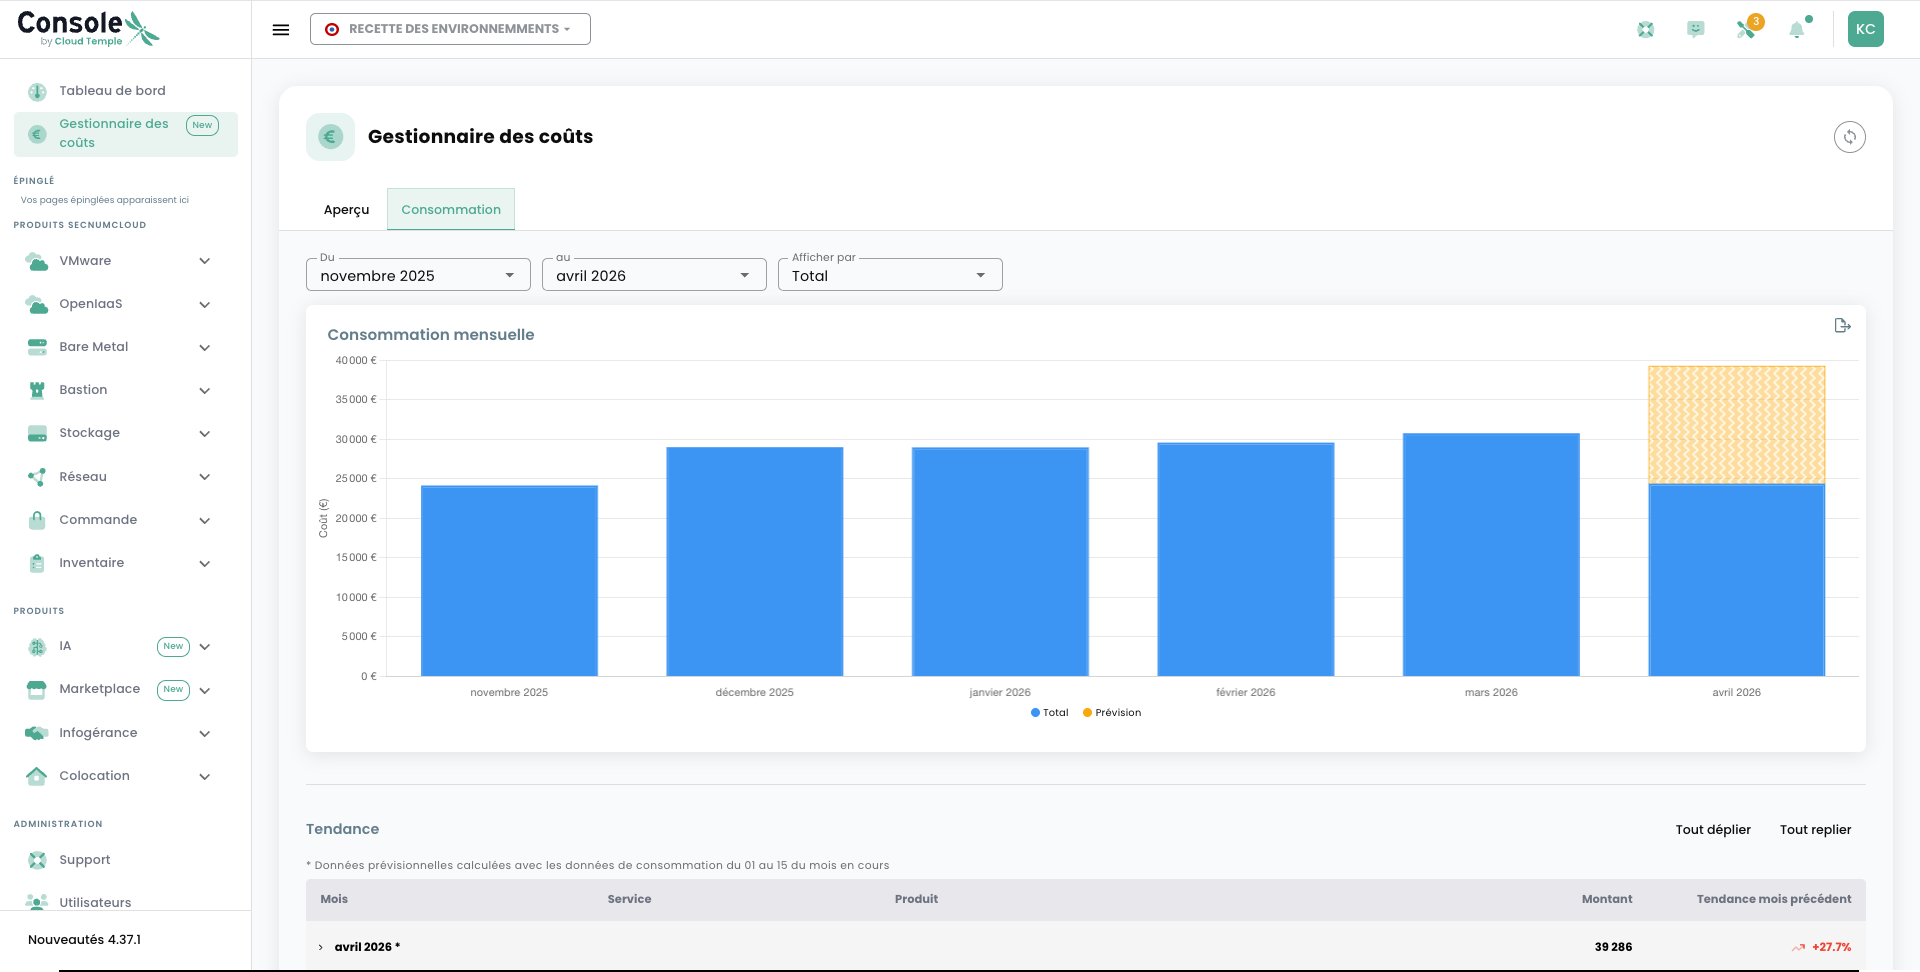
You can adjust the display period to refine your analysis: day, week, month, or custom range. The total consumption curve is directly readable and does not require any particular technical expertise.
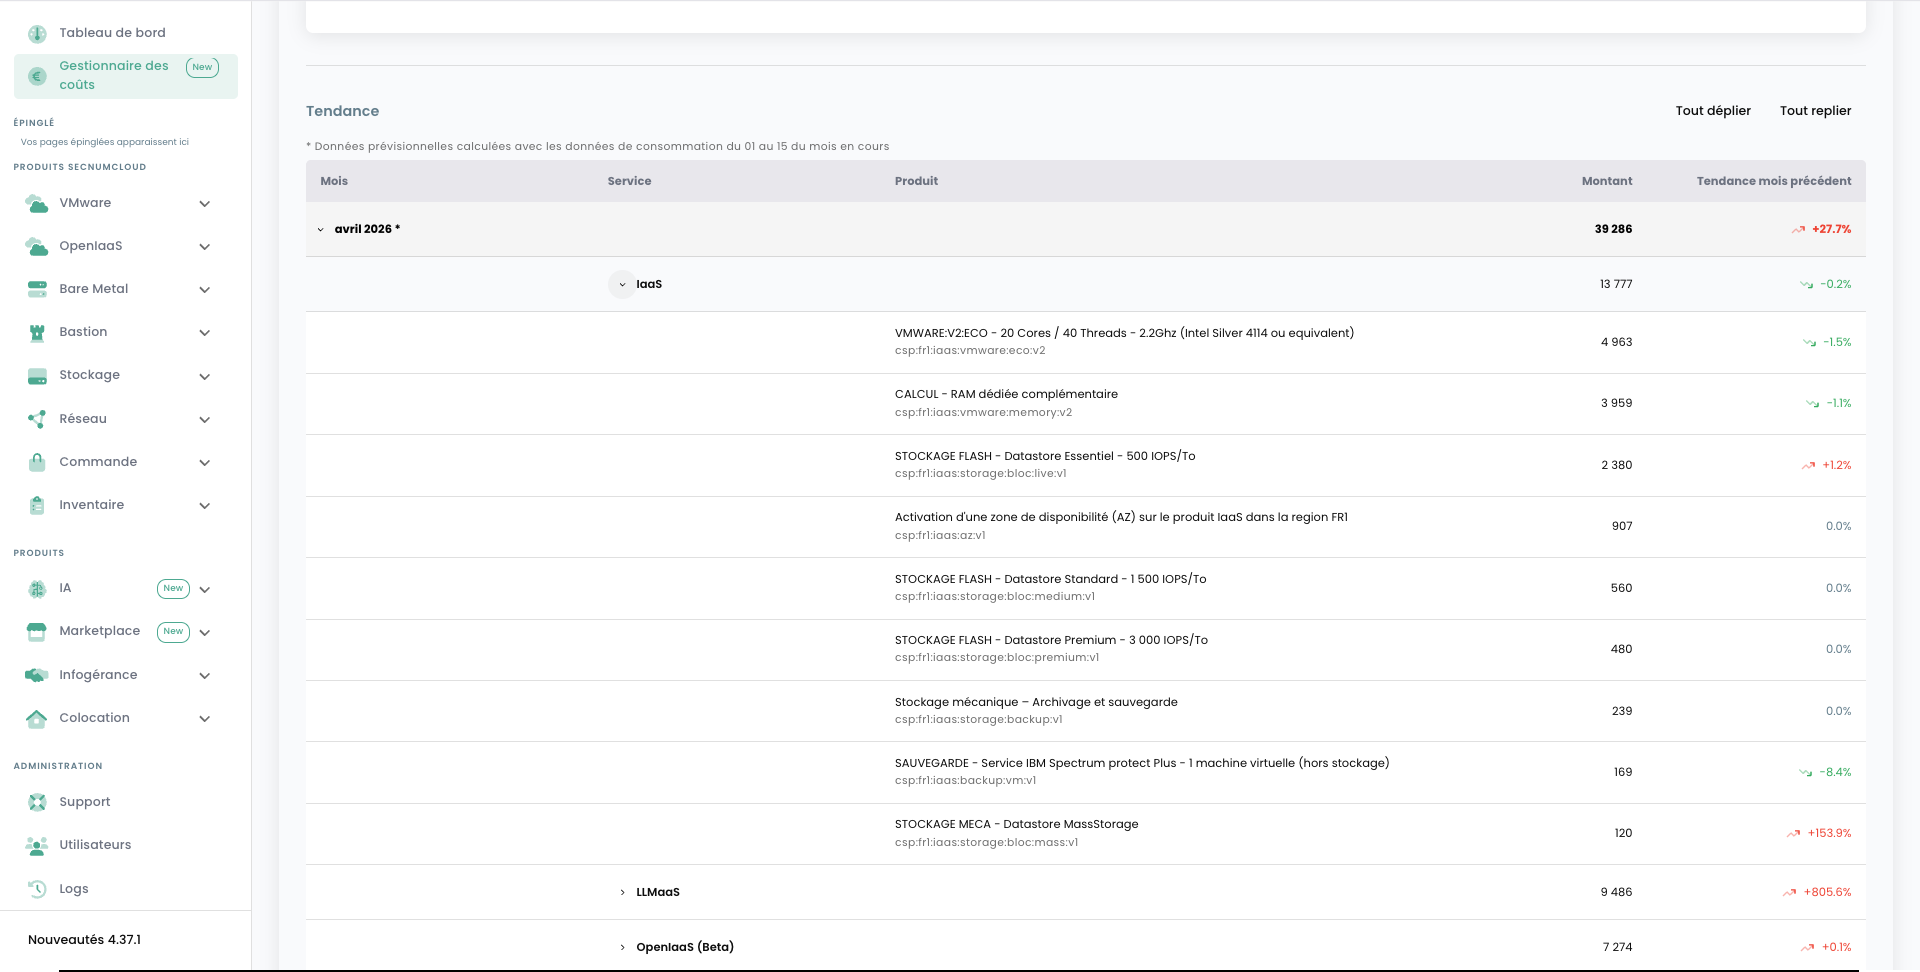
Consumption by Product
The Consumption by Product tab breaks down your consumption by the main Cloud Temple service categories you have subscribed to: compute, storage, networking, etc.
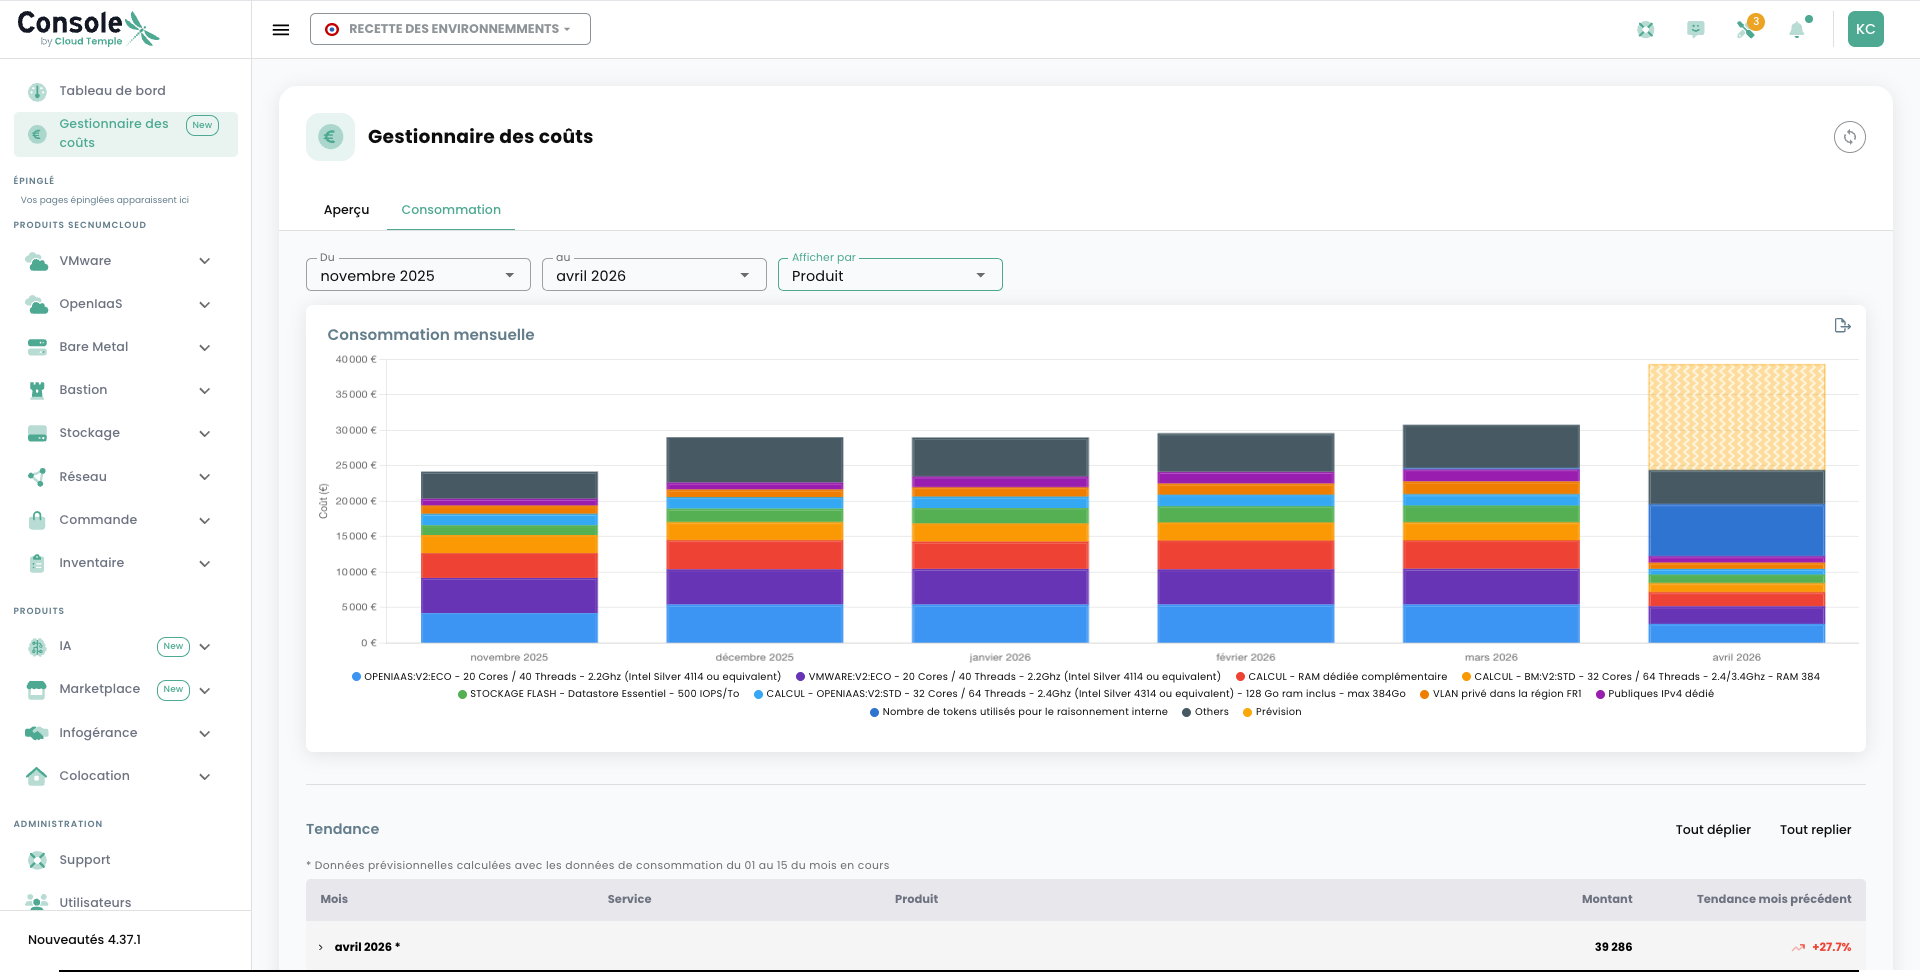
This view is particularly useful for identifying the most significant expense categories and guiding optimization decisions. Each product is represented with its relative share of total consumption, which facilitates reading and comparison.
Consumption by service
The Consumption by service tab provides an additional level of detail by breaking down consumption by specific service within each product.
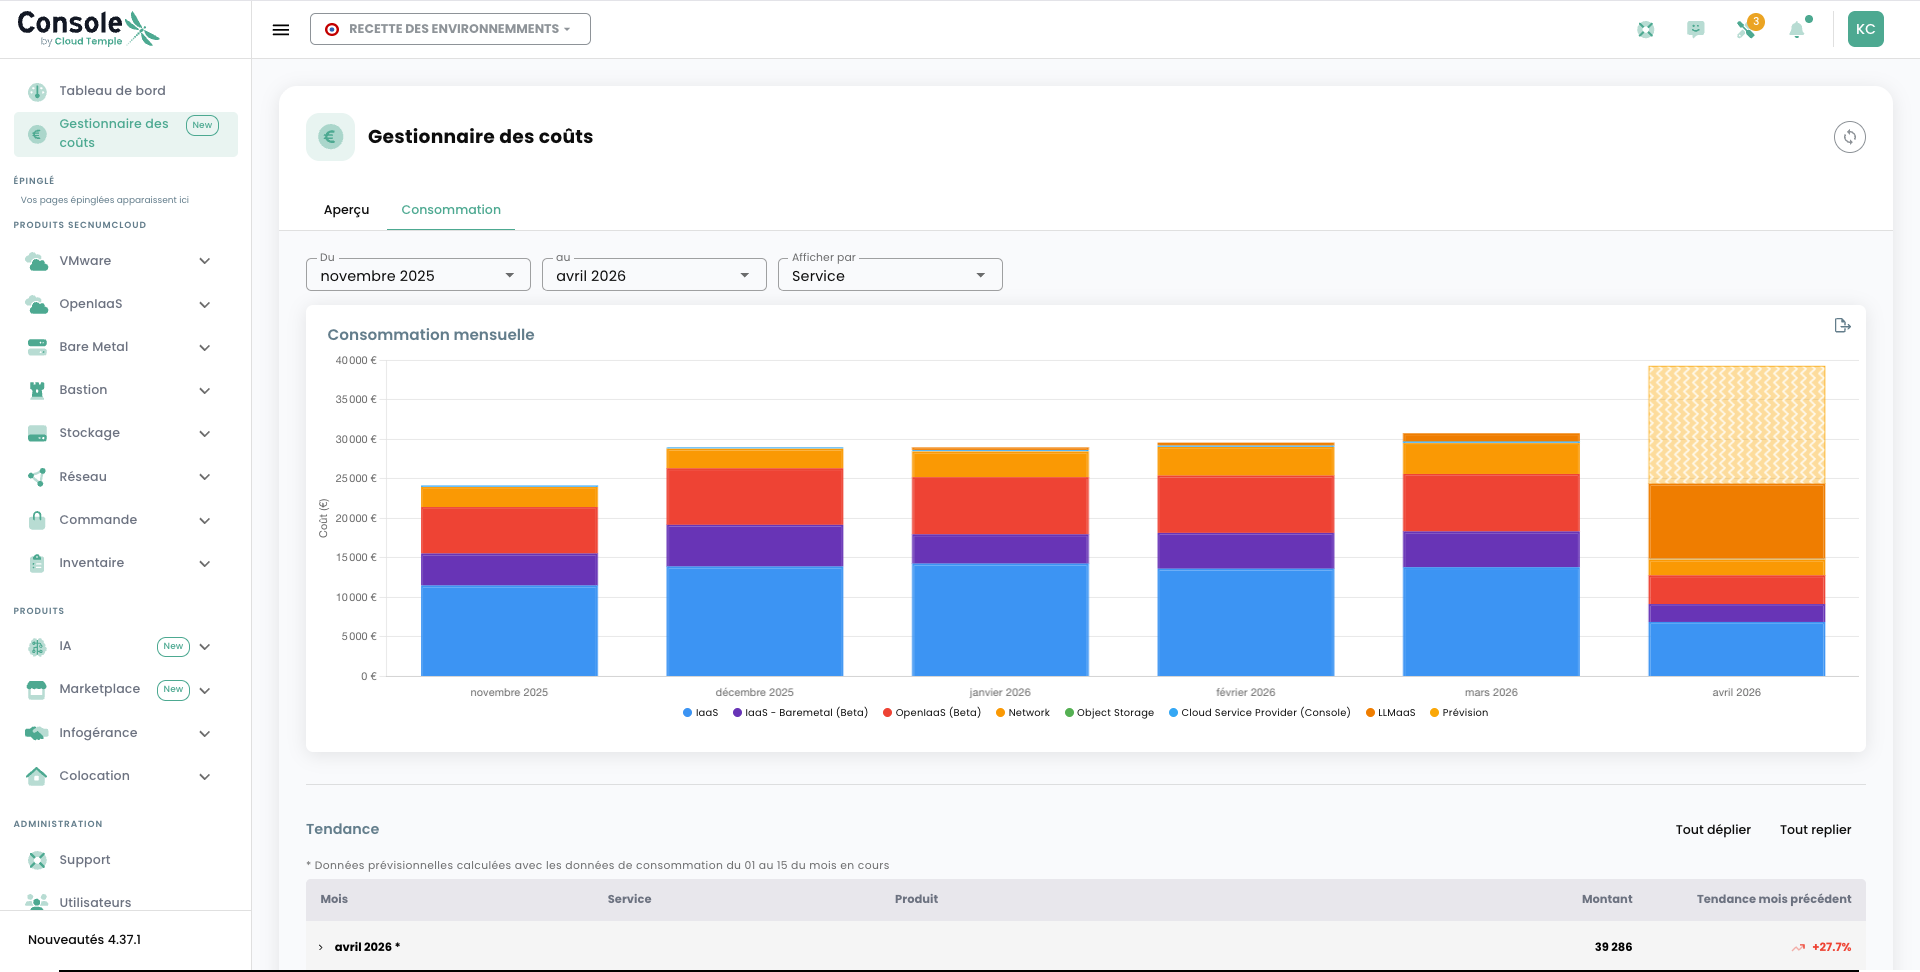
This level of granularity allows you to go further in your analysis: for example, you can distinguish the consumption of your virtual machines, block storage, snapshots, or network bandwidth, and thus precisely identify the resources that generate the highest costs.
Consumption Details
The Consumption Details view presents a comprehensive table listing all resources consumed during the period. Each row corresponds to an identifiable resource (virtual machine, storage volume, public IP address, etc.) with its associated consumption level.
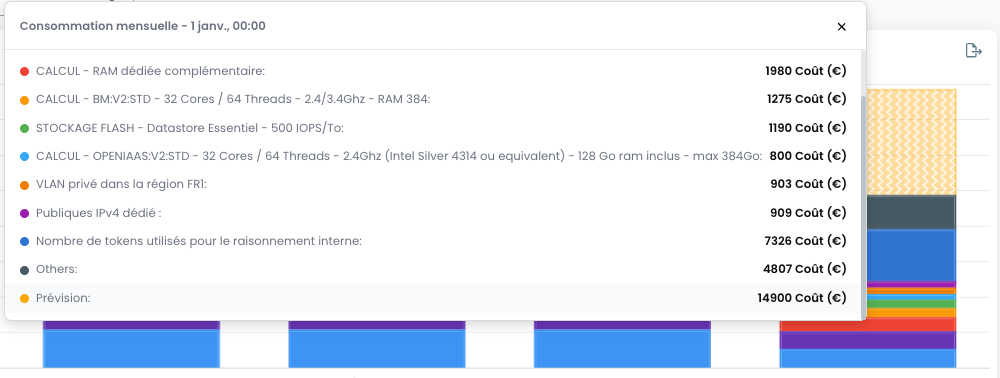
This detail is valuable for teams wishing to perform an analytical breakdown of their costs or to identify potentially unused resources that could be disabled to optimize spending.
Pricing Grid
The Pricing Grid (or Price List) tab lists all unit rates applicable to the resources available in your tenant. It is the current price catalog that allows you to estimate the cost of new resources before their deployment.
Each entry in the grid indicates:
- The resource type involved
- The billing unit (per hour, per GB, per unit, etc.)
- The applicable unit price
The pricing grid is your reference for estimating the cost of an infrastructure before ordering it. Combine this information with consumption data to identify optimization levers.
Best practices
To get the most out of the Cost Manager, here are some recommendations:
- Regularly monitor your usage to quickly detect any budget drift.
- Compare periods: the tool allows you to analyze month-over-month changes to identify trends.
- Use the service view to identify underutilized or forgotten resources (old snapshots, unattached volumes, etc.).
- Cross-reference with the pricing grid to evaluate the financial impact of any infrastructure changes before implementing them.